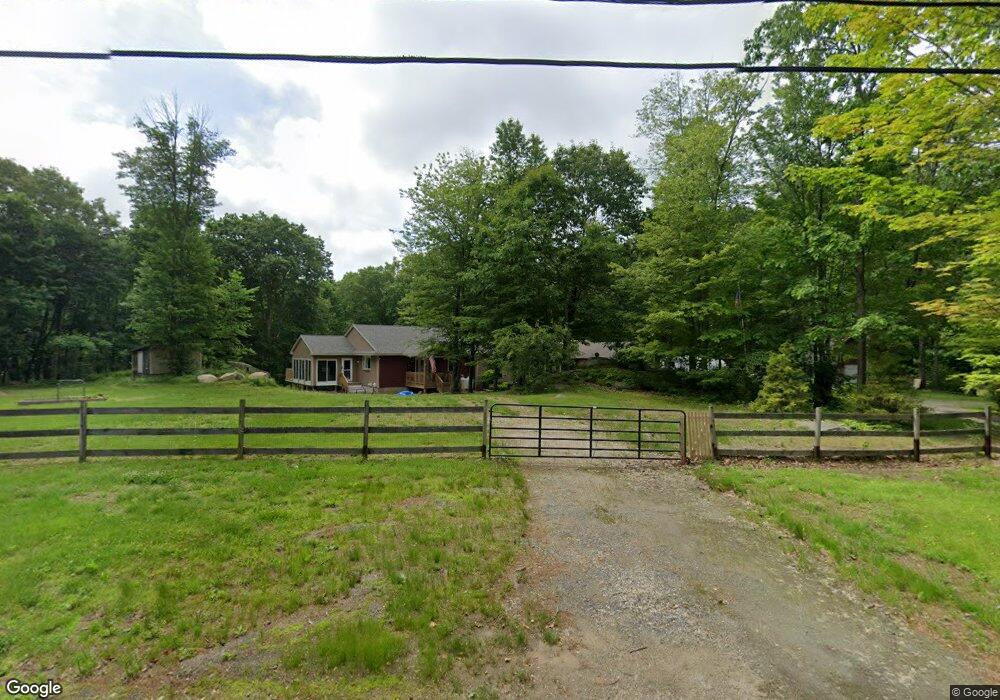
482 Emerys Bridge Rd South Berwick, ME 03908
Estimated Value: $1,184,603 - $1,378,000
3
Beds
3
Baths
2,992
Sq Ft
$434/Sq Ft
Est. Value
About This Home
This home is located at 482 Emerys Bridge Rd, South Berwick, ME 03908 and is currently estimated at $1,298,901, approximately $434 per square foot. 482 Emerys Bridge Rd is a home located in York County with nearby schools including Marshwood High School.
Ownership History
Date
Name
Owned For
Owner Type
Purchase Details
Closed on
Jul 21, 2025
Sold by
Kelley Shane N and Reis Nicole C
Bought by
Murch Christopher C
Current Estimated Value
Purchase Details
Closed on
Jul 20, 2023
Sold by
Lewis Paul C
Bought by
Kelley Shane N and Reis Nicole C
Home Financials for this Owner
Home Financials are based on the most recent Mortgage that was taken out on this home.
Original Mortgage
$722,500
Interest Rate
6.71%
Mortgage Type
Purchase Money Mortgage
Purchase Details
Closed on
Jan 21, 2016
Sold by
Mynes Harold R and Mynes Colleen S
Bought by
Lewis Paul C and Schule Heidi C
Purchase Details
Closed on
Jul 22, 2015
Sold by
Mynes Harold R and Mynes Colleen S
Bought by
Lewis Christopher and Schule Heidi C
Home Financials for this Owner
Home Financials are based on the most recent Mortgage that was taken out on this home.
Original Mortgage
$451,247
Interest Rate
4.01%
Mortgage Type
Purchase Money Mortgage
Create a Home Valuation Report for This Property
The Home Valuation Report is an in-depth analysis detailing your home's value as well as a comparison with similar homes in the area
Home Values in the Area
Average Home Value in this Area
Purchase History
| Date | Buyer | Sale Price | Title Company |
|---|---|---|---|
| Murch Christopher C | $1,350,000 | -- | |
| Murch Christopher C | $1,350,000 | -- | |
| Murch Christopher C | $1,350,000 | -- | |
| Kelley Shane N | -- | None Available | |
| Kelley Shane N | -- | None Available | |
| Kelley Shane N | -- | None Available | |
| Lewis Paul C | -- | -- | |
| Lewis Paul C | -- | -- | |
| Lewis Christopher | -- | -- | |
| Lewis Christopher | -- | -- |
Source: Public Records
Mortgage History
| Date | Status | Borrower | Loan Amount |
|---|---|---|---|
| Previous Owner | Kelley Shane N | $722,500 | |
| Previous Owner | Lewis Christopher | $451,247 |
Source: Public Records
Tax History Compared to Growth
Tax History
| Year | Tax Paid | Tax Assessment Tax Assessment Total Assessment is a certain percentage of the fair market value that is determined by local assessors to be the total taxable value of land and additions on the property. | Land | Improvement |
|---|---|---|---|---|
| 2024 | $10,311 | $768,300 | $144,300 | $624,000 |
| 2023 | $9,554 | $684,400 | $126,900 | $557,500 |
| 2022 | $8,896 | $611,800 | $141,700 | $470,100 |
| 2021 | $7,910 | $509,000 | $129,900 | $379,100 |
| 2020 | $8,068 | $461,000 | $115,800 | $345,200 |
| 2019 | $8,029 | $427,100 | $105,700 | $321,400 |
| 2018 | $8,203 | $425,000 | $105,800 | $319,200 |
| 2017 | $5,392 | $283,800 | $104,100 | $179,700 |
| 2016 | $5,170 | $282,490 | $103,590 | $178,900 |
| 2015 | $5,000 | $280,875 | $101,975 | $178,900 |
| 2014 | -- | $280,844 | $101,944 | $178,900 |
Source: Public Records
Map
Nearby Homes
- 100 Boyds Corner Rd
- 29 Great Hill Rd
- 208 Knights Pond Rd
- 2668 Tatnic Rd
- 23 Meader St
- 233 Wells St
- 17 Market St
- 22 Church Ave
- 43 Knights Pond Rd
- 0016/001 Newhall Rd
- 74 Maple St
- 110 Josiah Norton Rd
- 315 Hiltons Ln
- 50 Webber Ridge Ln
- 38 High St
- 4 Natures Way
- 5 Knights Pond Rd
- 3 Natures Way
- 1 Natures Way
- 133 Josiah Norton Rd
- 489 Emerys Bridge Rd
- 475 Emerys Bridge Rd
- 475 Emerys Bridge Rd
- 499 Emerys Bridge Rd
- 468 Emerys Bridge Rd
- 507 Emerys Bridge Rd
- 516 Emerys Bridge Rd
- 25 Bennett Lot Rd
- 39 Bennett Lot Rd
- 11 Bennett Lot Rd
- 451 Emerys Bridge Rd
- 11 Bennett Rd
- 11 Bennett Rd Unit Road
- 51 Bennett Lot Rd
- 551 Emerys Bridge Rd
- 30 Bennett Lot Rd
- 57 Bennett Lot Rd
- 522 Emerys Bridge Rd
- 0 Bennett Lot Rd Unit 218829
- 0 Bennett Lot Rd Unit 201606