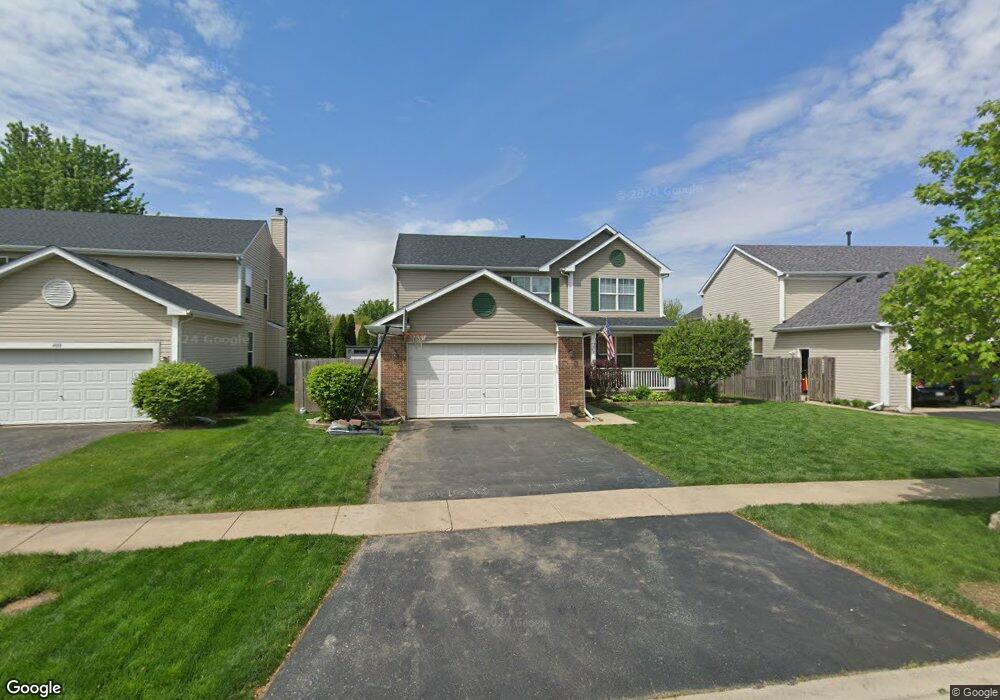
482 Grape Vine Trail Oswego, IL 60543
Northwest Oswego NeighborhoodEstimated Value: $410,000 - $424,000
4
Beds
3
Baths
2,426
Sq Ft
$172/Sq Ft
Est. Value
About This Home
This home is located at 482 Grape Vine Trail, Oswego, IL 60543 and is currently estimated at $416,409, approximately $171 per square foot. 482 Grape Vine Trail is a home located in Kendall County with nearby schools including Hunt Club Elementary School, Traughber Junior High School, and Oswego High School.
Ownership History
Date
Name
Owned For
Owner Type
Purchase Details
Closed on
May 29, 2008
Sold by
Debold Christopher K and Diebold Kristie J
Bought by
Reyes Alain
Current Estimated Value
Home Financials for this Owner
Home Financials are based on the most recent Mortgage that was taken out on this home.
Original Mortgage
$255,884
Interest Rate
6.01%
Mortgage Type
FHA
Purchase Details
Closed on
Dec 1, 2004
Sold by
Pasquinelli Blackberry Knoll Llc
Bought by
Gregory Kimberly A
Home Financials for this Owner
Home Financials are based on the most recent Mortgage that was taken out on this home.
Original Mortgage
$151,135
Interest Rate
5.62%
Mortgage Type
Purchase Money Mortgage
Purchase Details
Closed on
Sep 1, 2004
Sold by
Pasquinelli Blackberry Knoll Llc
Bought by
Diebold Christopher K and Diebold Kristie J
Home Financials for this Owner
Home Financials are based on the most recent Mortgage that was taken out on this home.
Original Mortgage
$221,299
Interest Rate
5.89%
Mortgage Type
Purchase Money Mortgage
Create a Home Valuation Report for This Property
The Home Valuation Report is an in-depth analysis detailing your home's value as well as a comparison with similar homes in the area
Home Values in the Area
Average Home Value in this Area
Purchase History
| Date | Buyer | Sale Price | Title Company |
|---|---|---|---|
| Reyes Alain | $260,000 | Chicago Title Insurance Co | |
| Gregory Kimberly A | $252,000 | Chicago Title Insurance Co | |
| Diebold Christopher K | $277,000 | Chicago Title Insurance Comp |
Source: Public Records
Mortgage History
| Date | Status | Borrower | Loan Amount |
|---|---|---|---|
| Previous Owner | Reyes Alain | $255,884 | |
| Previous Owner | Gregory Kimberly A | $151,135 | |
| Previous Owner | Diebold Christopher K | $221,299 |
Source: Public Records
Tax History Compared to Growth
Tax History
| Year | Tax Paid | Tax Assessment Tax Assessment Total Assessment is a certain percentage of the fair market value that is determined by local assessors to be the total taxable value of land and additions on the property. | Land | Improvement |
|---|---|---|---|---|
| 2024 | $8,999 | $118,687 | $13,302 | $105,385 |
| 2023 | $8,098 | $106,188 | $11,901 | $94,287 |
| 2022 | $8,098 | $96,403 | $10,804 | $85,599 |
| 2021 | $7,802 | $90,062 | $10,804 | $79,258 |
| 2020 | $7,406 | $85,576 | $10,804 | $74,772 |
| 2019 | $7,213 | $82,292 | $10,389 | $71,903 |
| 2018 | $7,237 | $77,816 | $10,389 | $67,427 |
| 2017 | $7,286 | $76,969 | $10,389 | $66,580 |
| 2016 | $3,313 | $69,309 | $10,389 | $58,920 |
| 2015 | $6,029 | $60,756 | $9,354 | $51,402 |
| 2014 | -- | $58,308 | $9,354 | $48,954 |
| 2013 | -- | $58,308 | $9,354 | $48,954 |
Source: Public Records
Map
Nearby Homes
- 158 Concord Dr S
- 424 Grape Vine Trail
- Aruba Cove with Full Basement Plan at The Colonies at Grande Reserve - Grande Reserve Ranch Homes
- Cayman Isle with Full Basement Plan at The Colonies at Grande Reserve - Grande Reserve Ranch Homes
- Bahama Bay with Full Basement Plan at The Colonies at Grande Reserve - Grande Reserve Ranch Homes
- 2666 Big Grove Cir
- 4478 E Millbrook Cir
- 4468 E Millbrook Cir
- 2454 Roxbury Ln
- 2417 Geneva Ln Unit 3
- 2465 Hillsboro Ln Unit 4
- 2717 Avalon Ln
- 4004 Shoeger Ct
- 17 Basswood Ct
- 614 Pineridge Dr N Unit 43
- 618 Pineridge Dr N Unit 618
- 3935 Havenhill Ct
- 19 Brookside Ln
- 7619 Mill Rd
- 19 Willow Ln
- 480 Grape Vine Trail
- 484 Grape Vine Trail
- 400 Grape Vine Trail
- 398 Grape Vine Trail
- 478 Grape Vine Trail
- 486 Grape Vine Trail
- 402 Grape Vine Trail
- 396 Grape Vine Trail
- 483 Grape Vine Trail
- 404 Grape Vine Trail
- 485 Grape Vine Trail
- 476 Grape Vine Trail
- 481 Grape Vine Trail
- 488 Grape Vine Trail
- 394 Grape Vine Trail
- 479 Grape Vine Trail
- 487 Grape Vine Trail
- 406 Grape Vine Trail
- 392 Grape Vine Trail
- 474 Grape Vine Trail