Estimated Value: $59,000 - $148,000
--
Bed
--
Bath
1,280
Sq Ft
$74/Sq Ft
Est. Value
About This Home
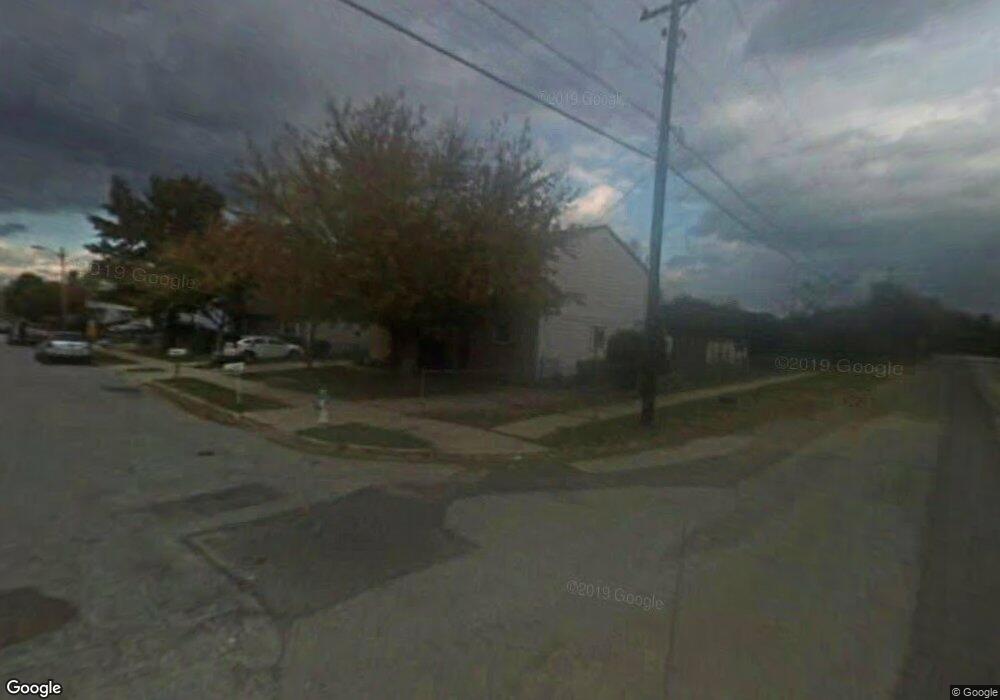
This home is located at 482 Kent St, Salem, NJ 08079 and is currently estimated at $94,263, approximately $73 per square foot. 482 Kent St is a home located in Salem County with nearby schools including John Fenwick Elementary School, Salem Middle School, and Salem High School.
Ownership History
Date
Name
Owned For
Owner Type
Purchase Details
Closed on
Aug 18, 2022
Sold by
Patterson Kashif Khalif and Propert Kash
Bought by
Big Deal Property Management Llc
Current Estimated Value
Purchase Details
Closed on
Jan 26, 2021
Sold by
Thomas Dennis R
Bought by
Kash Properties Llc
Purchase Details
Closed on
Jun 12, 2015
Sold by
Morris Leon and Morris Marie
Bought by
Thomas Dennis R
Home Financials for this Owner
Home Financials are based on the most recent Mortgage that was taken out on this home.
Original Mortgage
$29,456
Interest Rate
4.12%
Mortgage Type
FHA
Create a Home Valuation Report for This Property
The Home Valuation Report is an in-depth analysis detailing your home's value as well as a comparison with similar homes in the area
Home Values in the Area
Average Home Value in this Area
Purchase History
| Date | Buyer | Sale Price | Title Company |
|---|---|---|---|
| Big Deal Property Management Llc | $2,500 | Salem Oak Title | |
| Kash Properties Llc | $35,000 | Salem Oak Title Agency Inc | |
| Thomas Dennis R | $30,000 | None Available |
Source: Public Records
Mortgage History
| Date | Status | Borrower | Loan Amount |
|---|---|---|---|
| Previous Owner | Thomas Dennis R | $29,456 |
Source: Public Records
Tax History Compared to Growth
Tax History
| Year | Tax Paid | Tax Assessment Tax Assessment Total Assessment is a certain percentage of the fair market value that is determined by local assessors to be the total taxable value of land and additions on the property. | Land | Improvement |
|---|---|---|---|---|
| 2025 | $2,557 | $31,100 | $7,800 | $23,300 |
| 2024 | $2,445 | $31,100 | $7,800 | $23,300 |
| 2023 | $2,445 | $31,100 | $7,800 | $23,300 |
| 2022 | $2,338 | $31,100 | $7,800 | $23,300 |
| 2021 | $2,252 | $31,100 | $7,800 | $23,300 |
| 2020 | $2,212 | $31,100 | $7,800 | $23,300 |
| 2019 | $2,198 | $31,100 | $7,800 | $23,300 |
| 2018 | $2,150 | $31,100 | $7,800 | $23,300 |
| 2017 | $2,124 | $31,100 | $7,800 | $23,300 |
| 2016 | $2,448 | $62,500 | $10,000 | $52,500 |
| 2015 | $2,416 | $62,500 | $10,000 | $52,500 |
| 2014 | $2,404 | $62,500 | $10,000 | $52,500 |
Source: Public Records
Map
Nearby Homes
- 453 Afton Dr
- 433-435 Afton Dr
- 445 Afton Dr
- 441-443 Afton Dr
- 437-439 Afton Dr Afton Dr
- 61-63 Yorke St
- 39 Yorke St
- 14 Yorke St
- 410 Magnolia St
- 14 Hillcrest Terrace
- 10 Davis Ave
- 27 Davis Ave
- 385 387 E Broadway
- 369 E Broadway
- 330 332 E Broadway
- 171 Yorke St
- 200 N Union St
- 334 Craven Ave
- 5 Olive St
- 2 New Bridge Rd Unit C-3