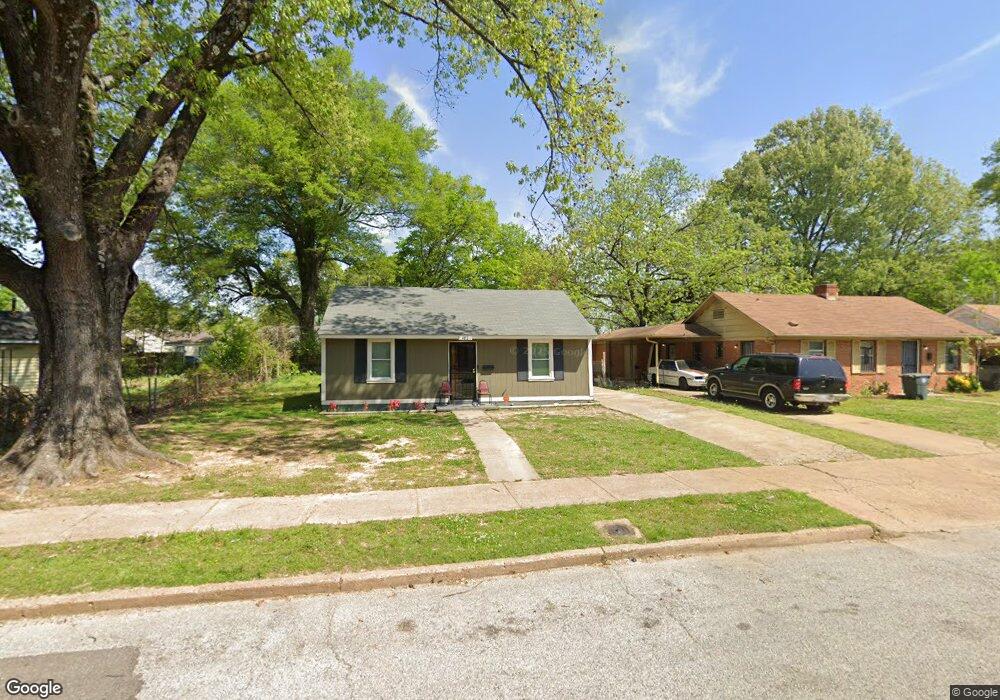
482 King Rd Memphis, TN 38109
Westwood NeighborhoodEstimated Value: $77,000 - $110,000
2
Beds
1
Bath
768
Sq Ft
$115/Sq Ft
Est. Value
About This Home
This home is located at 482 King Rd, Memphis, TN 38109 and is currently estimated at $88,057, approximately $114 per square foot. 482 King Rd is a home located in Shelby County with nearby schools including Ford Road Elementary School, Chickasaw Middle School, and Mitchell High School.
Ownership History
Date
Name
Owned For
Owner Type
Purchase Details
Closed on
May 9, 2023
Sold by
Che Qi
Bought by
Mount Diablo Properties Llc
Current Estimated Value
Purchase Details
Closed on
Sep 29, 2021
Sold by
Mid South Homebuyers Gp
Bought by
Che Qi
Purchase Details
Closed on
Mar 31, 2021
Sold by
Rogers Realty Investments Llc
Bought by
Mid South Homebuyers Gp
Purchase Details
Closed on
Apr 28, 2020
Sold by
Rogers Darriel
Bought by
Rogers Realty Investments Llc
Purchase Details
Closed on
Mar 19, 2020
Sold by
County Of Shelby
Bought by
Rogers Darriel
Purchase Details
Closed on
Feb 19, 2004
Sold by
Earl Benny L
Bought by
Longwood Delores E and Earl Benny L
Create a Home Valuation Report for This Property
The Home Valuation Report is an in-depth analysis detailing your home's value as well as a comparison with similar homes in the area
Home Values in the Area
Average Home Value in this Area
Purchase History
| Date | Buyer | Sale Price | Title Company |
|---|---|---|---|
| Mount Diablo Properties Llc | -- | None Listed On Document | |
| Che Qi | $87,500 | Sage Title Group Llc | |
| Mid South Homebuyers Gp | $14,000 | Saddle Creek Title Llc | |
| Rogers Realty Investments Llc | -- | Baymark T&E Svcs Llc | |
| Rogers Darriel | $2,700 | None Available | |
| Longwood Delores E | -- | -- |
Source: Public Records
Mortgage History
| Date | Status | Borrower | Loan Amount |
|---|---|---|---|
| Closed | Mid South Homebuyers Gp | $0 |
Source: Public Records
Tax History
| Year | Tax Paid | Tax Assessment Tax Assessment Total Assessment is a certain percentage of the fair market value that is determined by local assessors to be the total taxable value of land and additions on the property. | Land | Improvement |
|---|---|---|---|---|
| 2025 | $470 | $17,225 | $1,875 | $15,350 |
| 2024 | $470 | $13,850 | $1,350 | $12,500 |
| 2023 | $844 | $13,850 | $1,350 | $12,500 |
| 2022 | $844 | $13,850 | $1,350 | $12,500 |
| 2021 | $75 | $2,750 | $1,350 | $1,400 |
| 2020 | $118 | $0 | $0 | $0 |
| 2019 | $120 | $3,750 | $1,350 | $2,400 |
| 2018 | $120 | $3,750 | $1,350 | $2,400 |
| 2017 | $123 | $3,750 | $1,350 | $2,400 |
| 2016 | $264 | $6,050 | $0 | $0 |
| 2014 | $264 | $6,050 | $0 | $0 |
Source: Public Records
Map
Nearby Homes