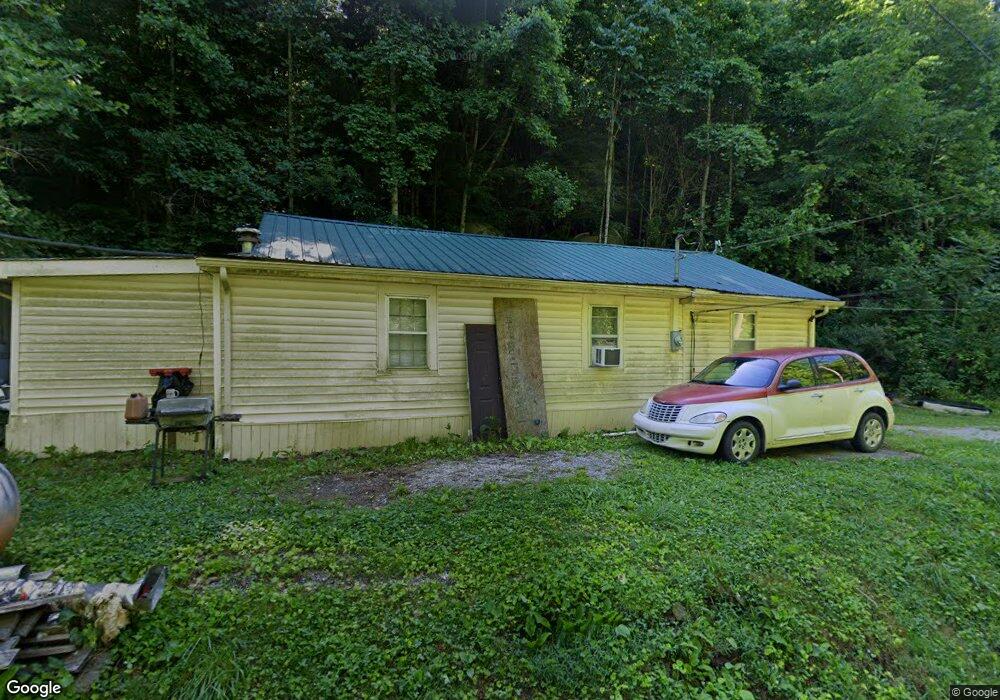
482 Laurel Branch Rd La Follette, TN 37766
Estimated Value: $42,620 - $159,000
--
Bed
1
Bath
782
Sq Ft
$133/Sq Ft
Est. Value
About This Home
This home is located at 482 Laurel Branch Rd, La Follette, TN 37766 and is currently estimated at $103,655, approximately $132 per square foot. 482 Laurel Branch Rd is a home located in Campbell County.
Ownership History
Date
Name
Owned For
Owner Type
Purchase Details
Closed on
Jun 7, 2024
Sold by
Bunch William S and Baird Anne M
Bought by
Bunch William Scott and Bunch Nancy Ann
Current Estimated Value
Purchase Details
Closed on
Jan 17, 2023
Sold by
Baird Donald
Bought by
Bunch William Scott and Bunch Nancy Ann
Purchase Details
Closed on
Feb 1, 2019
Sold by
Bunch William Scott and Estate Of James Howard Bolton
Bought by
Bunch William Scott and Bunch Nathan
Purchase Details
Closed on
Jul 24, 2017
Sold by
Baird Anne
Bought by
Baird Anne M
Purchase Details
Closed on
Apr 18, 2005
Sold by
Bolton Roy
Bought by
Bolton James
Purchase Details
Closed on
May 6, 2002
Bought by
Bolton Roy
Purchase Details
Closed on
Sep 12, 1995
Sold by
Bolton Claude Heirs
Bought by
Bolton Clifford
Purchase Details
Closed on
Jan 1, 1973
Bought by
Bolton Claude Heirs
Purchase Details
Closed on
Jan 2, 1900
Create a Home Valuation Report for This Property
The Home Valuation Report is an in-depth analysis detailing your home's value as well as a comparison with similar homes in the area
Home Values in the Area
Average Home Value in this Area
Purchase History
| Date | Buyer | Sale Price | Title Company |
|---|---|---|---|
| Bunch William Scott | -- | None Listed On Document | |
| Bunch William Scott | -- | None Listed On Document | |
| Bunch William Scott | $300 | -- | |
| Bunch William Scott | -- | None Available | |
| Baird Anne M | -- | None Available | |
| Bolton James | -- | -- | |
| Bolton Roy | $1,500 | -- | |
| Bolton Clifford | $5,000 | -- | |
| Bolton Claude Heirs | -- | -- | |
| -- | -- | -- |
Source: Public Records
Tax History Compared to Growth
Tax History
| Year | Tax Paid | Tax Assessment Tax Assessment Total Assessment is a certain percentage of the fair market value that is determined by local assessors to be the total taxable value of land and additions on the property. | Land | Improvement |
|---|---|---|---|---|
| 2025 | $56 | $4,600 | $0 | $0 |
| 2024 | $56 | $4,600 | $1,825 | $2,775 |
| 2023 | $176 | $8,525 | $775 | $7,750 |
| 2022 | $176 | $8,525 | $775 | $7,750 |
| 2021 | $176 | $8,525 | $775 | $7,750 |
| 2020 | $172 | $8,525 | $775 | $7,750 |
| 2019 | $176 | $8,525 | $775 | $7,750 |
| 2018 | $150 | $6,675 | $625 | $6,050 |
| 2017 | $150 | $6,675 | $625 | $6,050 |
| 2016 | $150 | $6,675 | $625 | $6,050 |
| 2015 | $133 | $6,675 | $625 | $6,050 |
| 2014 | $133 | $6,675 | $625 | $6,050 |
| 2013 | -- | $6,675 | $625 | $6,050 |
Source: Public Records
Map
Nearby Homes
- 0 Melvin Hollow Rd Unit LotWP001 23933593
- 0 Melvin Hollow Rd Unit LotWP003 23933595
- 0 Melvin Hollow Rd Unit 1305423
- 0 Melvin Hollow Rd Unit 1305420
- 0 Melvin Hollow Rd Unit 1271460
- 3329 Stinking Creek Rd
- 1055 Big 4 Rd
- 3866 Highway 297
- 256 Ensley Ln
- 130 Lowwood Ln
- 936 Stinking Creek Rd
- 739 Rock Creek Ln
- 143 Elk Ridge Ln
- 241 Oswego Rd
- 163 Wooldridge Ln
- 150 Timber Oaks Ln
- 0 Wooldridge Rd
- 1911 Branam Hill Rd
- 1732 Branam Hill Rd
- 0 6th Ave
- 523 Laurel Branch Rd
- 426 Laurel Branch Rd
- 380 Laurel Branch Rd
- 1470 Melvin Hollow Rd
- 1488 Melvin Hollow Rd
- 346 Laurel Branch Rd
- 1502 Melvin Hollow Rd
- 0 Melvin Hollow Rd Unit LotWP002 23933594
- 0 Melvin Hollow Rd Unit 1305410
- 0 Melvin Hollow Rd Unit LotWp001 14413383
- 0 Melvin Hollow Rd Unit 1260948
- 0 Melvin Hollow Rd Unit 1193991
- 0 Melvin Hollow Rd Unit 1192128
- 1527 Melvin Hollow Rd
- 296 Laurel Branch Rd
- 1395 Melvin Hollow Rd
- 1615 Melvin Hollow Rd
- 265 Laurel Branch Rd
- 125 Gillis Ln
- 1687 Melvin Hollow Rd