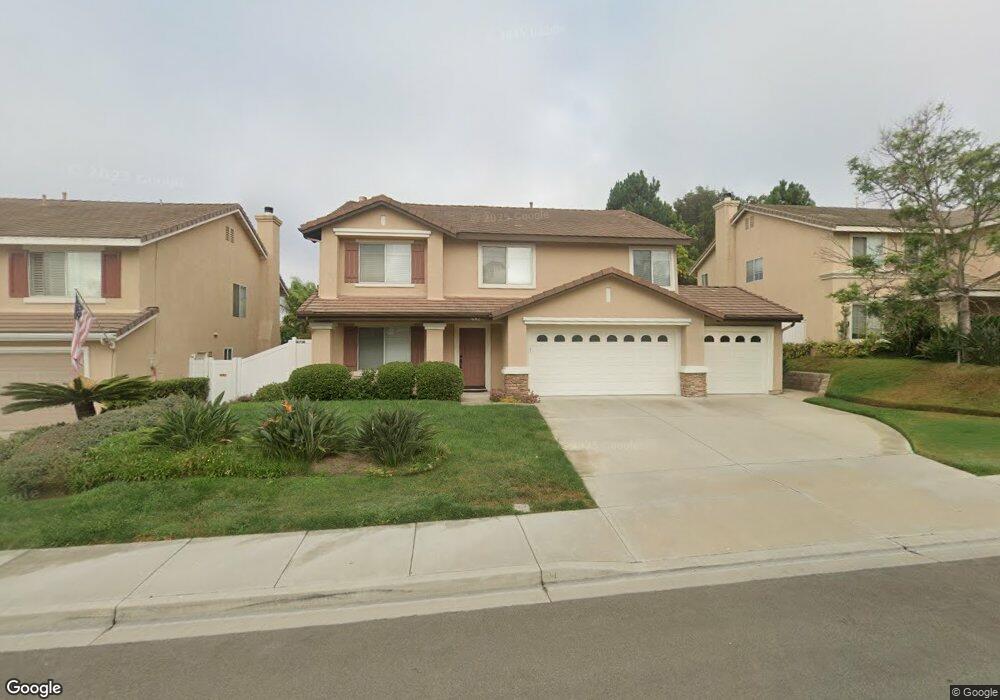
482 Lexington Cir Oceanside, CA 92057
Ivey Ranch-Rancho Del Oro NeighborhoodEstimated Value: $1,010,317 - $1,176,000
4
Beds
3
Baths
2,672
Sq Ft
$407/Sq Ft
Est. Value
About This Home
This home is located at 482 Lexington Cir, Oceanside, CA 92057 and is currently estimated at $1,087,579, approximately $407 per square foot. 482 Lexington Cir is a home located in San Diego County with nearby schools including Ivey Ranch Elementary School, Martin Luther King Jr. Middle School, and El Camino High School.
Ownership History
Date
Name
Owned For
Owner Type
Purchase Details
Closed on
Jun 18, 2009
Sold by
Solis Mario C and Solis Jocylen D
Bought by
Lai Chon Leong and Cheong Mei Sio
Current Estimated Value
Home Financials for this Owner
Home Financials are based on the most recent Mortgage that was taken out on this home.
Original Mortgage
$397,000
Outstanding Balance
$258,047
Interest Rate
5.31%
Mortgage Type
Purchase Money Mortgage
Estimated Equity
$829,532
Purchase Details
Closed on
Feb 26, 2008
Sold by
Solis Mario C and Solis Jocylen D
Bought by
Solis Mario C and Solis Jocylen D
Purchase Details
Closed on
Oct 1, 1998
Sold by
Lmd Ivey Ranch Llc
Bought by
Solis Mario Carlo and Solis Jocylen Dinglasan
Home Financials for this Owner
Home Financials are based on the most recent Mortgage that was taken out on this home.
Original Mortgage
$224,900
Interest Rate
6.69%
Mortgage Type
Purchase Money Mortgage
Create a Home Valuation Report for This Property
The Home Valuation Report is an in-depth analysis detailing your home's value as well as a comparison with similar homes in the area
Home Values in the Area
Average Home Value in this Area
Purchase History
| Date | Buyer | Sale Price | Title Company |
|---|---|---|---|
| Lai Chon Leong | $497,000 | American Coast Title | |
| Solis Mario C | -- | None Available | |
| Solis Mario C | -- | None Available | |
| Solis Mario Carlo | $250,000 | -- |
Source: Public Records
Mortgage History
| Date | Status | Borrower | Loan Amount |
|---|---|---|---|
| Open | Lai Chon Leong | $397,000 | |
| Previous Owner | Solis Mario Carlo | $224,900 |
Source: Public Records
Tax History Compared to Growth
Tax History
| Year | Tax Paid | Tax Assessment Tax Assessment Total Assessment is a certain percentage of the fair market value that is determined by local assessors to be the total taxable value of land and additions on the property. | Land | Improvement |
|---|---|---|---|---|
| 2025 | $7,005 | $641,518 | $283,971 | $357,547 |
| 2024 | $7,005 | $628,940 | $278,403 | $350,537 |
| 2023 | $6,788 | $616,609 | $272,945 | $343,664 |
| 2022 | $6,684 | $604,520 | $267,594 | $336,926 |
| 2021 | $6,709 | $592,668 | $262,348 | $330,320 |
| 2020 | $6,501 | $586,591 | $259,658 | $326,933 |
| 2019 | $6,311 | $575,090 | $254,567 | $320,523 |
| 2018 | $6,242 | $563,815 | $249,576 | $314,239 |
| 2017 | $6,127 | $552,761 | $244,683 | $308,078 |
| 2016 | $5,927 | $541,924 | $239,886 | $302,038 |
| 2015 | $5,753 | $533,785 | $236,283 | $297,502 |
| 2014 | $5,529 | $523,330 | $231,655 | $291,675 |
Source: Public Records
Map
Nearby Homes
- 301 Arlington Dr
- 416 Alyssum Way
- 4146 Periwinkle Way
- 735 Buena Tierra Way Unit 355
- 4082 Ivey Vista Way
- 4265 Spoon Bill Way
- 4269 Black Duck Way
- 712 Buena Tierra Way Unit 176
- 120 Venetia Way
- 4220 La Pinata Way Unit 236
- 4320 Black Duck Way
- 4545 Milano Way
- 190 Bautista Ct Unit 99
- 4730 Milano Way
- 4369 Dowitcher Way
- 4402 Chickadee Way
- 4394 Dowitcher Way
- 4408 Shearwater Way
- 4418 Chickadee Way
- 213 Melinda Way
- 480 Lexington Cir
- 484 Lexington Cir
- 300 Arlington Dr
- 302 Arlington Dr
- 478 Lexington Cir
- 500 Lexington Cir
- 502 Lexington Cir
- 498 Lexington Cir
- 304 Arlington Dr
- 481 Lexington Cir
- 483 Lexington Cir
- 504 Lexington Cir
- 479 Lexington Cir
- 476 Lexington Cir
- 485 Lexington Cir
- 306 Arlington Dr
- 477 Lexington Cir
- 487 Lexington Ct
- 474 Lexington Cir
- 475 Lexington Cir