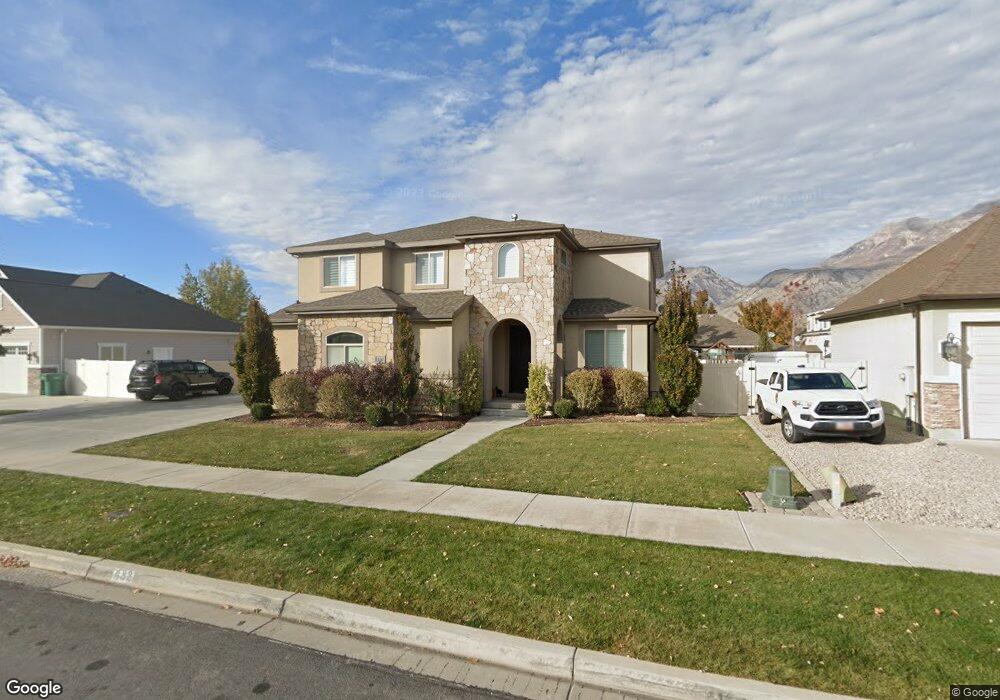
482 W 1830 N Orem, UT 84057
Northridge NeighborhoodEstimated Value: $803,442 - $1,024,000
4
Beds
3
Baths
3,903
Sq Ft
$226/Sq Ft
Est. Value
About This Home
This home is located at 482 W 1830 N, Orem, UT 84057 and is currently estimated at $881,861, approximately $225 per square foot. 482 W 1830 N is a home located in Utah County with nearby schools including Northridge Elementary School, Oak Canyon Junior High School, and Timpanogos High School.
Ownership History
Date
Name
Owned For
Owner Type
Purchase Details
Closed on
Jul 1, 2020
Sold by
Dastrup Linda L and Linda L Dastrup Family Trust
Bought by
Dastrup Jarom and Dastrup Jill
Current Estimated Value
Home Financials for this Owner
Home Financials are based on the most recent Mortgage that was taken out on this home.
Original Mortgage
$510,400
Outstanding Balance
$452,589
Interest Rate
3.1%
Mortgage Type
New Conventional
Estimated Equity
$429,272
Purchase Details
Closed on
Dec 27, 2017
Sold by
Dastrup Linda L
Bought by
Dastrup Linda L and Linda L Astrup Family Trust
Purchase Details
Closed on
Sep 9, 2016
Sold by
Barney Connie and Utpog Irrevocable Living Trust
Bought by
Dastrup Linda Lee
Purchase Details
Closed on
Jun 1, 2016
Sold by
Dastrup Linda Lee
Bought by
Barney Connie and Utpog Irrevocable Living Trust
Purchase Details
Closed on
Feb 10, 2012
Sold by
Millhaven Construction Llc
Bought by
Dastrup Linda Lee
Create a Home Valuation Report for This Property
The Home Valuation Report is an in-depth analysis detailing your home's value as well as a comparison with similar homes in the area
Home Values in the Area
Average Home Value in this Area
Purchase History
| Date | Buyer | Sale Price | Title Company |
|---|---|---|---|
| Dastrup Jarom | -- | Paramount Title Corporation | |
| Dastrup Linda L | -- | None Available | |
| Dastrup Linda Lee | -- | Accommodation | |
| Barney Connie | -- | Paramount Title Corporation | |
| Dastrup Linda Lee | -- | Union Title |
Source: Public Records
Mortgage History
| Date | Status | Borrower | Loan Amount |
|---|---|---|---|
| Open | Dastrup Jarom | $510,400 |
Source: Public Records
Tax History
| Year | Tax Paid | Tax Assessment Tax Assessment Total Assessment is a certain percentage of the fair market value that is determined by local assessors to be the total taxable value of land and additions on the property. | Land | Improvement |
|---|---|---|---|---|
| 2025 | $3,275 | $419,705 | -- | -- |
| 2024 | $3,275 | $400,510 | $0 | $0 |
| 2023 | $3,106 | $408,155 | $0 | $0 |
| 2022 | $3,161 | $402,490 | $0 | $0 |
| 2021 | $2,870 | $553,400 | $194,900 | $358,500 |
| 2020 | $2,696 | $510,900 | $169,500 | $341,400 |
| 2019 | $2,572 | $507,000 | $169,500 | $337,500 |
| 2018 | $2,509 | $472,500 | $169,500 | $303,000 |
| 2017 | $2,285 | $259,875 | $0 | $0 |
| 2016 | $2,683 | $249,535 | $0 | $0 |
| 2015 | $658 | $242,825 | $0 | $0 |
| 2014 | -- | $217,855 | $0 | $0 |
Source: Public Records
Map
Nearby Homes
- 1948 N 520 W
- 1916 N 430 W
- 127 S 400 E
- 1744 N 280 W
- 90 S 200 E
- 1547 N 275 West St Unit 5
- 1545 N State St Unit 1
- 240 E Center St
- 1566 N 275 West St Unit 1
- 1548 N 275 West St Unit 2
- 1552 N 740 W
- 1917 N 860 W
- 1461 N Amiron Way Unit B
- 49 W 1880 N
- 512 W 1450 N
- 527 W 1450 N
- 229 E 60 N
- 332 W Amiron Way Unit D
- 92 W 1565 N
- 967 W 1630 N
Your Personal Tour Guide
Ask me questions while you tour the home.