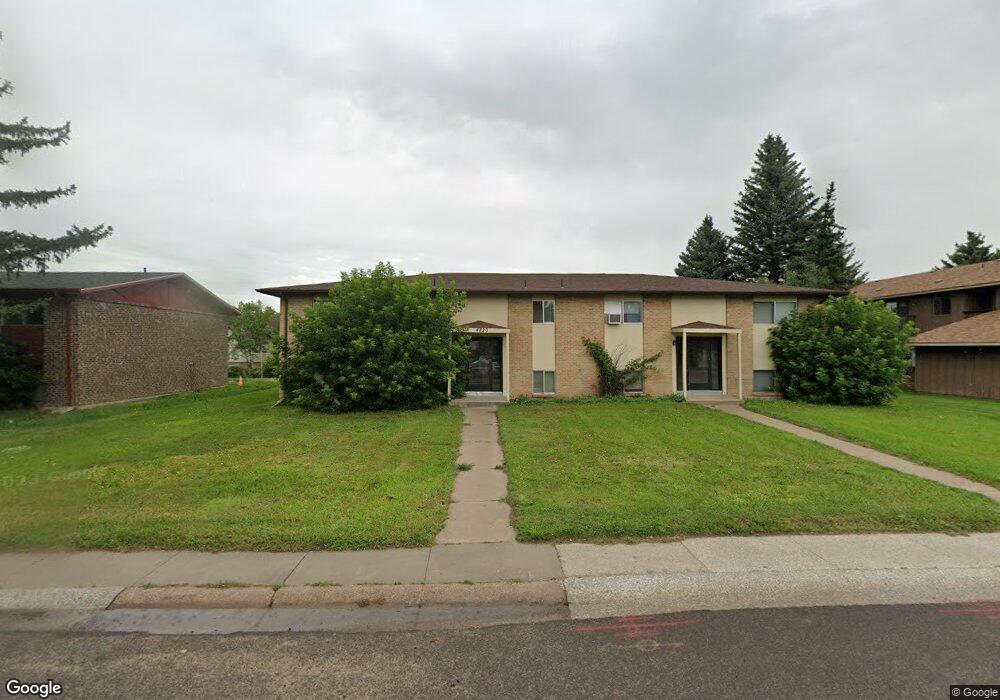
4820 E 12th St Cheyenne, WY 82001
Estimated Value: $693,238
8
Beds
4
Baths
--
Sq Ft
13,504
Sq Ft
About This Home
This home is located at 4820 E 12th St, Cheyenne, WY 82001 and is currently estimated at $693,238. 4820 E 12th St is a home located in Laramie County with nearby schools including Bain Elementary School, Johnson Junior High School, and South High School.
Ownership History
Date
Name
Owned For
Owner Type
Purchase Details
Closed on
Oct 30, 2020
Sold by
Zwonltzer David L
Bought by
Leemer Investments
Current Estimated Value
Home Financials for this Owner
Home Financials are based on the most recent Mortgage that was taken out on this home.
Original Mortgage
$393,750
Outstanding Balance
$336,402
Interest Rate
2.8%
Mortgage Type
New Conventional
Estimated Equity
$356,836
Purchase Details
Closed on
Oct 29, 2020
Sold by
Hansen Janice and Janice Hansen Living Trust
Bought by
Zwonitzer David L
Home Financials for this Owner
Home Financials are based on the most recent Mortgage that was taken out on this home.
Original Mortgage
$393,750
Outstanding Balance
$336,402
Interest Rate
2.8%
Mortgage Type
New Conventional
Estimated Equity
$356,836
Purchase Details
Closed on
Jun 20, 2003
Sold by
Hansen Janice K
Bought by
Hansen Janice and Janice Hansen Living Trust
Create a Home Valuation Report for This Property
The Home Valuation Report is an in-depth analysis detailing your home's value as well as a comparison with similar homes in the area
Purchase History
| Date | Buyer | Sale Price | Title Company |
|---|---|---|---|
| Leemer Investments | -- | New Title Company Name | |
| Leemer Investments | -- | New Title Company Name | |
| Zwonitzer David L | -- | Laramie Cnty Abstract & Ttl | |
| Zwonitzer David L | -- | New Title Company Name | |
| Hansen Janice | -- | -- |
Source: Public Records
Mortgage History
| Date | Status | Borrower | Loan Amount |
|---|---|---|---|
| Open | Leemer Investments | $393,750 | |
| Closed | Leemer Investments | $393,750 | |
| Closed | Zwonitzer David L | $393,750 |
Source: Public Records
Tax History
| Year | Tax Paid | Tax Assessment Tax Assessment Total Assessment is a certain percentage of the fair market value that is determined by local assessors to be the total taxable value of land and additions on the property. | Land | Improvement |
|---|---|---|---|---|
| 2025 | $2,014 | $33,229 | $5,521 | $27,708 |
| 2024 | $2,014 | $28,481 | $5,521 | $22,960 |
| 2023 | $2,057 | $29,090 | $5,521 | $23,569 |
| 2022 | $2,097 | $29,058 | $5,521 | $23,537 |
| 2021 | $1,870 | $25,854 | $5,521 | $20,333 |
| 2020 | $1,865 | $25,854 | $5,521 | $20,333 |
| 2019 | $1,897 | $26,278 | $5,521 | $20,757 |
| 2018 | $1,837 | $25,681 | $5,323 | $20,358 |
| 2017 | $1,795 | $24,871 | $5,323 | $19,548 |
| 2016 | $2,102 | $29,112 | $5,323 | $23,789 |
| 2015 | $2,138 | $29,597 | $5,323 | $24,274 |
| 2014 | $2,119 | $29,146 | $5,323 | $23,823 |
Source: Public Records
Map
Nearby Homes
- TBD Taft Ave
- 4404 Cottage Ln
- 4400 E 13th St
- 4920 E 6th St
- 1532 Copperville Rd
- 1609 Maroon Dr
- 5250 Atlantic Dr
- 5241 Atlantic Dr
- 4705 Raleigh Dr
- Lot 10 Raleigh Dr
- Lot 11 Raleigh Dr
- Lot 12 Raleigh Dr
- 4800 Ranch House Way
- 1823 Copperville Rd
- Lot 2 E 13th St
- 4022 E 7th St
- 5805 Kennedy Dr
- 4716 Saddleback Dr
- 2010 Meadow Dr
- 2100 Meadow Dr
- 4812 E 12th St
- 1200 Taft Ave
- 4808 E 12th St
- 1226 Taft Ave
- 1222 Taft Ave
- 4819 E 12th St
- 4811 E 12th St
- 4730 E 12th St
- 1230 Taft Ave
- 1218 Taft Ave
- 4809 E 13th St
- 4809 E 13th St
- 1106 Taft Ave
- 1201 Taft Ave Unit 10A
- 1201 Taft Ave Unit 10D
- 1201 Taft Ave Unit 10C
- 1201 Taft Ave Unit 10B
- 1201 Taft Ave
- 1232 Taft Ave
- 955 Sun Valley Dr
Your Personal Tour Guide
Ask me questions while you tour the home.