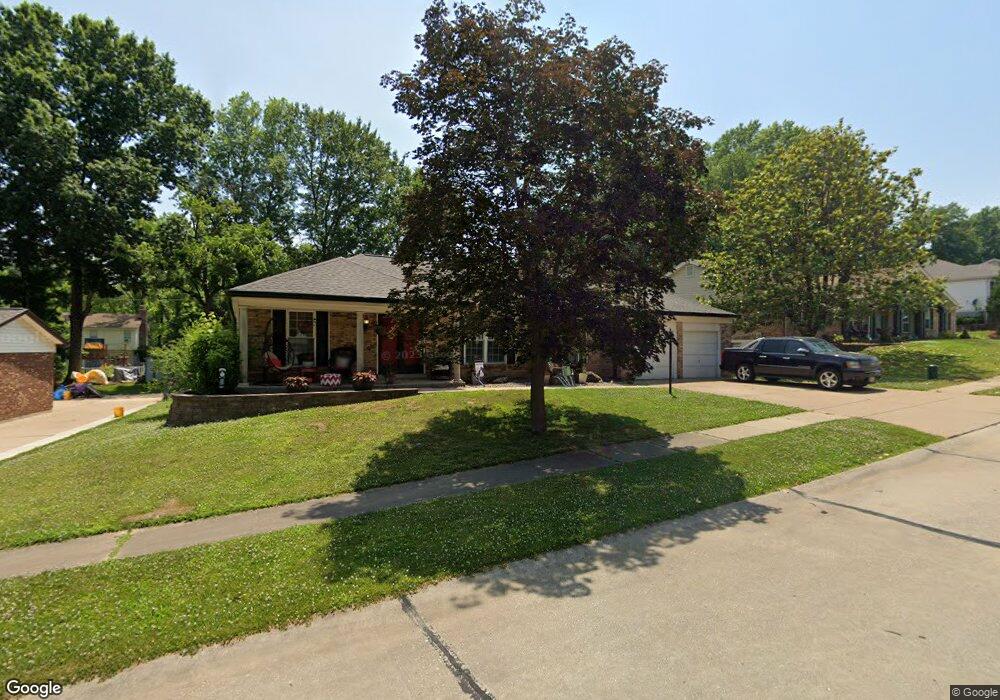
4820 Royal King Ct Saint Louis, MO 63128
Estimated Value: $318,000 - $395,194
3
Beds
3
Baths
1,896
Sq Ft
$184/Sq Ft
Est. Value
About This Home
This home is located at 4820 Royal King Ct, Saint Louis, MO 63128 and is currently estimated at $349,299, approximately $184 per square foot. 4820 Royal King Ct is a home located in St. Louis County with nearby schools including Hagemann Elementary School, Washington Middle School, and Mehlville High School.
Ownership History
Date
Name
Owned For
Owner Type
Purchase Details
Closed on
May 2, 2025
Sold by
Komo Amanda E
Bought by
Komo Lawton C
Current Estimated Value
Purchase Details
Closed on
Feb 10, 2021
Sold by
Komo Lawton C
Bought by
Komo Lawton C and Komo Amanda E
Purchase Details
Closed on
Jul 16, 2004
Sold by
Mcmanus Stephen A
Bought by
Komo Lawton C
Home Financials for this Owner
Home Financials are based on the most recent Mortgage that was taken out on this home.
Original Mortgage
$184,000
Interest Rate
6.32%
Mortgage Type
Purchase Money Mortgage
Purchase Details
Closed on
Mar 13, 1997
Sold by
Bischoff Raymond F and Bischoff Penny L
Bought by
Mcmanus Stephen A
Home Financials for this Owner
Home Financials are based on the most recent Mortgage that was taken out on this home.
Original Mortgage
$137,700
Interest Rate
7.74%
Create a Home Valuation Report for This Property
The Home Valuation Report is an in-depth analysis detailing your home's value as well as a comparison with similar homes in the area
Home Values in the Area
Average Home Value in this Area
Purchase History
| Date | Buyer | Sale Price | Title Company |
|---|---|---|---|
| Komo Lawton C | -- | None Listed On Document | |
| Komo Lawton C | -- | None Available | |
| Komo Lawton C | $230,000 | -- | |
| Mcmanus Stephen A | -- | -- |
Source: Public Records
Mortgage History
| Date | Status | Borrower | Loan Amount |
|---|---|---|---|
| Previous Owner | Komo Lawton C | $184,000 | |
| Previous Owner | Mcmanus Stephen A | $137,700 | |
| Closed | Komo Lawton C | $34,500 |
Source: Public Records
Tax History Compared to Growth
Tax History
| Year | Tax Paid | Tax Assessment Tax Assessment Total Assessment is a certain percentage of the fair market value that is determined by local assessors to be the total taxable value of land and additions on the property. | Land | Improvement |
|---|---|---|---|---|
| 2025 | $3,931 | $64,090 | $19,290 | $44,800 |
| 2024 | $3,931 | $58,540 | $15,450 | $43,090 |
| 2023 | $3,931 | $58,540 | $15,450 | $43,090 |
| 2022 | $3,221 | $48,780 | $14,480 | $34,300 |
| 2021 | $3,117 | $48,780 | $14,480 | $34,300 |
| 2020 | $3,335 | $49,660 | $12,500 | $37,160 |
| 2019 | $3,325 | $49,660 | $12,500 | $37,160 |
| 2018 | $3,316 | $44,730 | $9,600 | $35,130 |
| 2017 | $3,312 | $44,730 | $9,600 | $35,130 |
| 2016 | $3,512 | $45,530 | $9,600 | $35,930 |
| 2015 | $3,223 | $45,530 | $9,600 | $35,930 |
| 2014 | $2,913 | $40,700 | $9,270 | $31,430 |
Source: Public Records
Map
Nearby Homes
- 5626 Greenton Way
- 4968 Quail Crest Ct
- 5028 Baldcypress Ct
- 5812 Chrisbrook Dr
- 5952 Shortleaf Ct
- 4716 Medalton Way
- 5714 Shining Day Place
- 4523 Beaver Brook Ct
- 5414 Village Courtway Ln
- 5401 Green Cedar Way Unit 6
- 5174 Hollow Wood Ct Unit C
- 5162 Hollow Wood Ct Unit D
- 13266 East Ln
- 5100 Hollow Wood Ct Unit D
- 5106 Hollow Wood Ct Unit C
- 13232 East Ln
- 13372 Bahnfyre Dr
- 6006 Grand Marnier Dr
- 5417 Morningdale Place
- 4540 Butler Hill Rd
- 4814 Royal King Ct
- 4826 Royal King Ct
- 4815 Melissa Jo Ln
- 4821 Melissa Jo Ln
- 4803 Melissa Jo Ln
- 4832 Royal King Ct
- 4827 Melissa Jo Ln
- 4819 Royal King Ct
- 4825 Royal King Ct
- 4806 Royal King Ct
- 4775 Melissa Jo Ln
- 4813 Royal King Ct
- 4831 Royal King Ct
- 4833 Melissa Jo Ln
- 4838 Royal King Ct
- 4800 Royal King Ct
- 4837 Royal King Ct
- 4820 Melissa Jo Ln
- 4839 Melissa Jo Ln
- 4826 Melissa Jo Ln