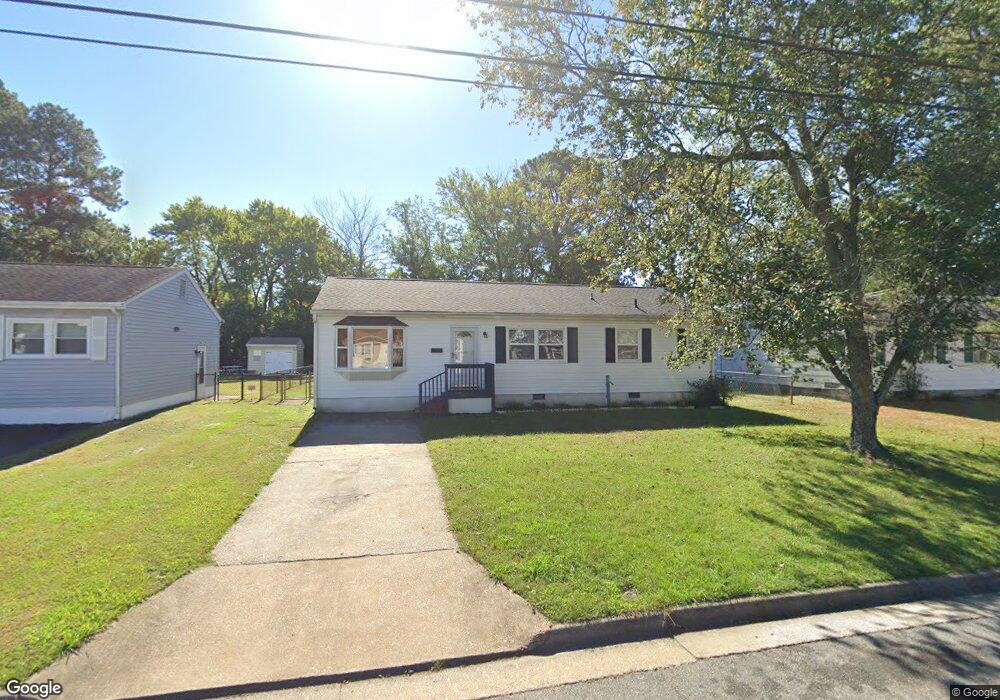
4823 82nd St Newport News, VA 23605
Briarfield NeighborhoodEstimated Value: $215,000 - $253,000
3
Beds
1
Bath
1,248
Sq Ft
$188/Sq Ft
Est. Value
About This Home
This home is located at 4823 82nd St, Newport News, VA 23605 and is currently estimated at $234,363, approximately $187 per square foot. 4823 82nd St is a home located in Hampton City with nearby schools including Forrest Elementary School, Cesar Tarrant Middle School, and Bethel High School.
Ownership History
Date
Name
Owned For
Owner Type
Purchase Details
Closed on
Oct 16, 2014
Sold by
Secretary Of H U D Washington
Bought by
Tna Holdings Llc
Current Estimated Value
Purchase Details
Closed on
Apr 25, 2014
Sold by
Bank Of America Na
Bought by
Secretary Of H U D
Purchase Details
Closed on
Apr 14, 2014
Sold by
Equity Trustees Llc Sub Tr
Bought by
Bank Of America Na
Purchase Details
Closed on
Mar 11, 2005
Sold by
Monday Clyde
Bought by
White Andrell
Home Financials for this Owner
Home Financials are based on the most recent Mortgage that was taken out on this home.
Original Mortgage
$133,997
Interest Rate
5.56%
Mortgage Type
FHA
Create a Home Valuation Report for This Property
The Home Valuation Report is an in-depth analysis detailing your home's value as well as a comparison with similar homes in the area
Home Values in the Area
Average Home Value in this Area
Purchase History
| Date | Buyer | Sale Price | Title Company |
|---|---|---|---|
| Tna Holdings Llc | $70,000 | -- | |
| Secretary Of H U D | $62,778 | -- | |
| Bank Of America Na | $62,778 | -- | |
| White Andrell | $136,100 | -- |
Source: Public Records
Mortgage History
| Date | Status | Borrower | Loan Amount |
|---|---|---|---|
| Previous Owner | White Andrell | $133,997 |
Source: Public Records
Tax History Compared to Growth
Tax History
| Year | Tax Paid | Tax Assessment Tax Assessment Total Assessment is a certain percentage of the fair market value that is determined by local assessors to be the total taxable value of land and additions on the property. | Land | Improvement |
|---|---|---|---|---|
| 2025 | $2,377 | $248,200 | $60,000 | $188,200 |
| 2024 | $2,377 | $206,700 | $60,000 | $146,700 |
| 2023 | $2,079 | $179,200 | $55,000 | $124,200 |
| 2022 | $1,920 | $162,700 | $50,000 | $112,700 |
| 2021 | $1,787 | $133,600 | $40,000 | $93,600 |
| 2020 | $1,556 | $125,500 | $36,000 | $89,500 |
| 2019 | $1,570 | $126,600 | $36,000 | $90,600 |
| 2018 | $1,863 | $126,100 | $36,000 | $90,100 |
| 2017 | $1,658 | $0 | $0 | $0 |
| 2016 | $1,677 | $127,700 | $0 | $0 |
| 2015 | $1,677 | $0 | $0 | $0 |
| 2014 | $1,744 | $129,900 | $40,000 | $89,900 |
Source: Public Records
Map
Nearby Homes