4823 Oakview St Shawnee, KS 66216
Estimated Value: $627,888 - $662,000
4
Beds
5
Baths
3,156
Sq Ft
$205/Sq Ft
Est. Value
About This Home
This home is located at 4823 Oakview St, Shawnee, KS 66216 and is currently estimated at $647,722, approximately $205 per square foot. 4823 Oakview St is a home located in Johnson County with nearby schools including Ray Marsh Elementary School, Trailridge Middle School, and Shawnee Mission Northwest High School.
Ownership History
Date
Name
Owned For
Owner Type
Purchase Details
Closed on
Dec 14, 2009
Sold by
Kuse Kevin Wayne
Bought by
Kuse Kevin Wayne and Kuse Shawn Diane
Current Estimated Value
Purchase Details
Closed on
Jan 9, 2006
Sold by
Bounds Danita A
Bought by
Kuse Kevin W
Home Financials for this Owner
Home Financials are based on the most recent Mortgage that was taken out on this home.
Original Mortgage
$195,000
Outstanding Balance
$109,150
Interest Rate
6.2%
Mortgage Type
New Conventional
Estimated Equity
$538,572
Purchase Details
Closed on
Oct 28, 2003
Sold by
Bounds Royce L and Bounds Royce L
Bought by
Bounds Danita A
Create a Home Valuation Report for This Property
The Home Valuation Report is an in-depth analysis detailing your home's value as well as a comparison with similar homes in the area
Home Values in the Area
Average Home Value in this Area
Purchase History
| Date | Buyer | Sale Price | Title Company |
|---|---|---|---|
| Kuse Kevin Wayne | -- | None Available | |
| Kuse Kevin W | -- | Cbkc Title And Escrow Llc | |
| Bounds Danita A | $36,000 | -- |
Source: Public Records
Mortgage History
| Date | Status | Borrower | Loan Amount |
|---|---|---|---|
| Open | Kuse Kevin W | $195,000 |
Source: Public Records
Tax History Compared to Growth
Tax History
| Year | Tax Paid | Tax Assessment Tax Assessment Total Assessment is a certain percentage of the fair market value that is determined by local assessors to be the total taxable value of land and additions on the property. | Land | Improvement |
|---|---|---|---|---|
| 2024 | $6,375 | $59,777 | $14,221 | $45,556 |
| 2023 | $5,959 | $55,476 | $12,354 | $43,122 |
| 2022 | $5,743 | $53,279 | $12,354 | $40,925 |
| 2021 | $5,462 | $47,748 | $11,226 | $36,522 |
| 2020 | $5,497 | $47,437 | $11,226 | $36,211 |
| 2019 | $5,271 | $45,448 | $10,195 | $35,253 |
| 2018 | $5,253 | $45,126 | $10,195 | $34,931 |
| 2017 | $5,368 | $45,413 | $9,262 | $36,151 |
| 2016 | $5,339 | $44,597 | $8,818 | $35,779 |
| 2015 | $5,033 | $43,412 | $8,818 | $34,594 |
| 2013 | -- | $39,790 | $8,818 | $30,972 |
Source: Public Records
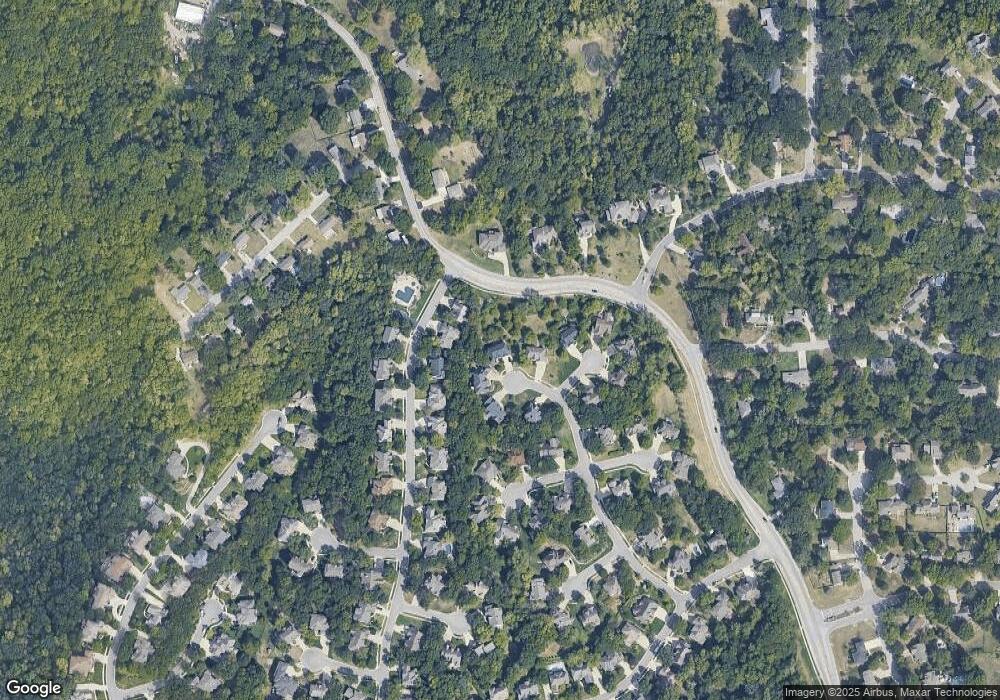
Map
Nearby Homes
- 4940 Alden St
- 14210 W 50th St
- 14105 W 48th Terrace
- 13810 W 53rd St
- 5502 Mullen Rd
- 5300 Summit Ct
- 180 Terrace Trail S
- 13804 W 55th Terrace
- 5013 Bradshaw St
- 5021 Bradshaw St
- 5530 Rene St
- 5633 Oakview St
- 14170 W 49th St
- 13305 W 51st St
- 5507 Noland Rd
- 5713 Widmer Rd
- 5703 Cottonwood St
- 132 Lakeshore Dr W
- 6804 Woodend Ave
- 110 Terrace Trail St W
- 4827 Oakview St
- 4829 Alden St
- 4820 Oakview St
- 4837 Alden St
- 14520 W 48th Terrace
- 4845 Alden St
- 4824 Oakview St
- 4853 Alden St
- 4828 Oakview St
- 4743 Quivira Dr
- 4751 Quivira Dr
- 14516 W 48th Terrace
- 4840 Alden St
- 4901 Alden St
- 14519 W 48th Terrace
- 14606 W 49th St
- 4848 Alden St
- 14602 W 49th St
- 14610 W 49th St
- 4759 Quivira Dr