48239 Vista de Nopal La Quinta, CA 92253
Estimated Value: $634,000 - $906,000
3
Beds
3
Baths
2,189
Sq Ft
$348/Sq Ft
Est. Value
About This Home
This home is located at 48239 Vista de Nopal, La Quinta, CA 92253 and is currently estimated at $762,112, approximately $348 per square foot. 48239 Vista de Nopal is a home with nearby schools including Harry S. Truman Elementary School, La Quinta Middle School, and La Quinta High School.
Ownership History
Date
Name
Owned For
Owner Type
Purchase Details
Closed on
Feb 3, 2009
Sold by
Hollinshead Robert and Hollinshead Susan
Bought by
Hollinshead Robert and Hollinshead Susan
Current Estimated Value
Purchase Details
Closed on
Mar 24, 2008
Sold by
Brown Wayne A and Brown Lisa Cappel
Bought by
Hollinshead Robert and Hollinshead Susan
Purchase Details
Closed on
Jan 28, 2004
Sold by
Garner Steven R and Garner Kamion L
Bought by
Brown Wayne A and Brown Lisa Cappel
Purchase Details
Closed on
Oct 1, 2003
Sold by
Skogen Dennis P and Skogen Diana L
Bought by
Garner Steven R and Garner Kamion L
Purchase Details
Closed on
Jul 17, 2002
Sold by
Boehme Joe and Boehme Sally
Bought by
Skogen Dennis P and Skogen Diana L
Purchase Details
Closed on
May 10, 1999
Sold by
Burr Adrian Kenneth
Bought by
Boehme Joe and Boehme Sally
Purchase Details
Closed on
Nov 19, 1993
Sold by
Grossman Abe and Grossman Thelma
Bought by
Fourth La Paz Properties Inc
Create a Home Valuation Report for This Property
The Home Valuation Report is an in-depth analysis detailing your home's value as well as a comparison with similar homes in the area
Home Values in the Area
Average Home Value in this Area
Purchase History
| Date | Buyer | Sale Price | Title Company |
|---|---|---|---|
| Hollinshead Robert | -- | Southland Title | |
| Hollinshead Robert | $217,500 | Southland Title Inland Empir | |
| Brown Wayne A | $185,000 | New Century Title Company Ri | |
| Garner Steven R | $155,000 | New Century Title Company | |
| Skogen Dennis P | $110,000 | First American Title Co | |
| Boehme Joe | $76,000 | Chicago Title Co | |
| Fourth La Paz Properties Inc | -- | -- |
Source: Public Records
Tax History Compared to Growth
Tax History
| Year | Tax Paid | Tax Assessment Tax Assessment Total Assessment is a certain percentage of the fair market value that is determined by local assessors to be the total taxable value of land and additions on the property. | Land | Improvement |
|---|---|---|---|---|
| 2025 | $8,519 | $646,744 | $285,676 | $361,068 |
| 2023 | $8,306 | $621,633 | $274,584 | $347,049 |
| 2022 | $8,077 | $609,445 | $269,200 | $340,245 |
| 2021 | $7,689 | $580,676 | $256,745 | $323,931 |
| 2020 | $6,865 | $518,461 | $229,237 | $289,224 |
| 2019 | $6,670 | $503,360 | $222,560 | $280,800 |
| 2018 | $6,417 | $484,000 | $214,000 | $270,000 |
| 2017 | $6,194 | $465,000 | $205,000 | $260,000 |
| 2016 | $6,177 | $465,000 | $205,000 | $260,000 |
| 2015 | $5,644 | $413,000 | $182,000 | $231,000 |
| 2014 | $5,531 | $403,000 | $178,000 | $225,000 |
Source: Public Records
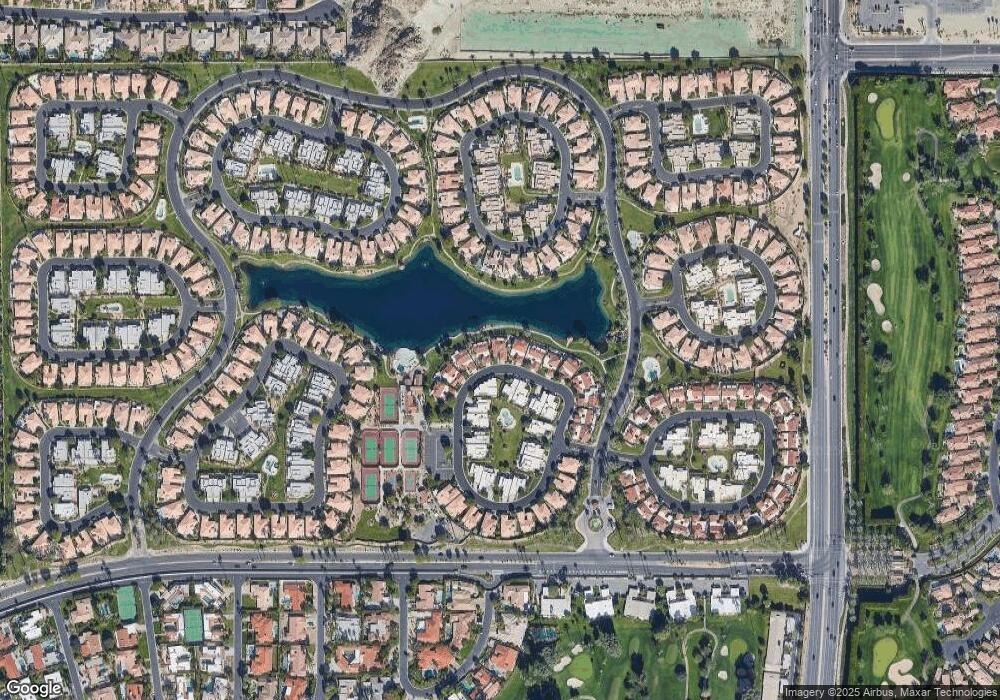
Map
Nearby Homes
- 48205 Vista de Nopal
- 48211 Vista de Nopal
- 48538 Via Amistad
- 48111 Calle Seranas
- 48511 Via Encanto
- 48113 Vista Cielo
- 48509 Via Encanto
- 47650 Eisenhower Dr
- 48121 Calle Seranas
- 48123 Calle Seranas
- 48119 Via Hermosa
- 0 Washington St Unit 219125512DA
- 48721 San Vicente St
- 48503 Via Amistad
- 48614 Paseo Tarazo
- 48613 Calle Esperanza
- 48611 Calle Esperanza
- 49091 Washington St
- 49035 Serenata Ct
- 78758 Via Carmel
- 48241 Vista de Nopal
- 48237 Vista de Nopal
- 48243 Vista de Nopal
- 48235 Vista de Nopal
- 48240 Vista de Nopal
- 48236 Vista de Nopal
- 48245 Vista de Nopal
- 48242 Vista de Nopal
- 48233 Vista de Nopal
- 48230 Vista de Nopal
- 48244 Vista de Nopal
- 48247 Vista de Nopal
- 48231 Vista de Nopal
- 48228 Vista de Nopal
- 48211 Calle Florista
- 48213 Calle Florista
- 48249 Vista de Nopal
- 48209 Calle Florista
- 48229 Vista de Nopal
- 48252 Vista de Nopal