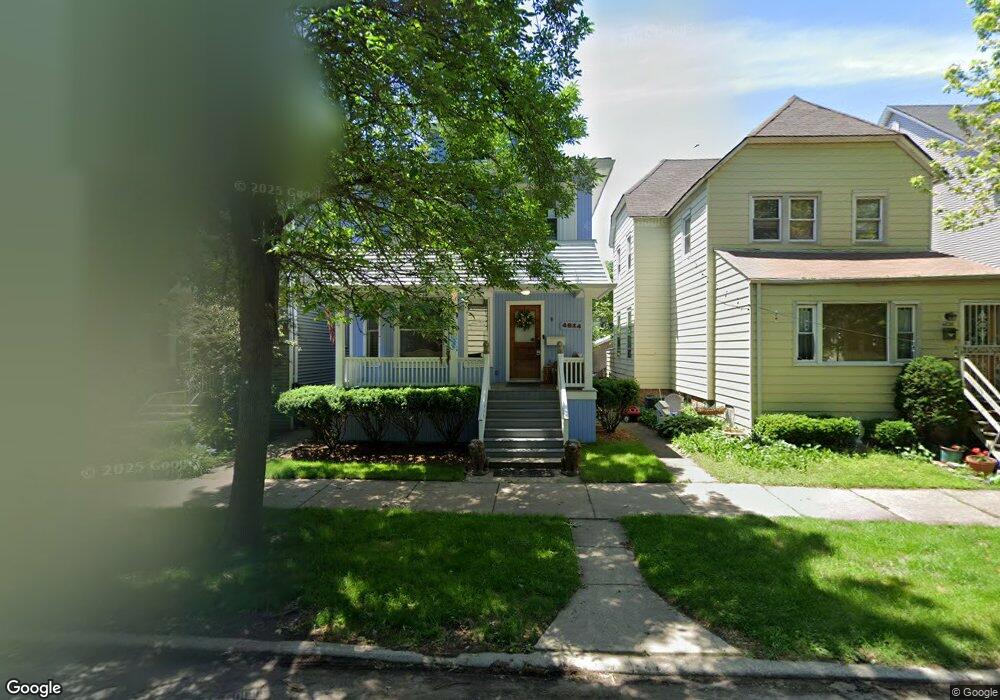
4824 N Hamilton Ave Chicago, IL 60625
Ravenswood NeighborhoodEstimated Value: $978,917 - $1,095,000
3
Beds
3
Baths
1,672
Sq Ft
$615/Sq Ft
Est. Value
About This Home
This home is located at 4824 N Hamilton Ave, Chicago, IL 60625 and is currently estimated at $1,027,979, approximately $614 per square foot. 4824 N Hamilton Ave is a home located in Cook County with nearby schools including McPherson Elementary School, Amundsen High School, and St. Matthias School.
Ownership History
Date
Name
Owned For
Owner Type
Purchase Details
Closed on
Dec 8, 2017
Sold by
Zolla William G and Zolla Gabi E
Bought by
Howanski Kenneth
Current Estimated Value
Home Financials for this Owner
Home Financials are based on the most recent Mortgage that was taken out on this home.
Original Mortgage
$544,000
Outstanding Balance
$458,119
Interest Rate
3.95%
Mortgage Type
New Conventional
Estimated Equity
$569,860
Purchase Details
Closed on
Jun 29, 2006
Sold by
Liljedahl Nancy J and Friedman Joel
Bought by
Zolla William and Zolla Gabi E
Home Financials for this Owner
Home Financials are based on the most recent Mortgage that was taken out on this home.
Original Mortgage
$455,000
Interest Rate
6.12%
Mortgage Type
Purchase Money Mortgage
Purchase Details
Closed on
Dec 29, 1998
Sold by
Lindstrom Lowell J and Lindstrom Jennifer
Bought by
Liljedahl Nancy J
Home Financials for this Owner
Home Financials are based on the most recent Mortgage that was taken out on this home.
Original Mortgage
$220,000
Interest Rate
6.79%
Create a Home Valuation Report for This Property
The Home Valuation Report is an in-depth analysis detailing your home's value as well as a comparison with similar homes in the area
Home Values in the Area
Average Home Value in this Area
Purchase History
| Date | Buyer | Sale Price | Title Company |
|---|---|---|---|
| Howanski Kenneth | $680,000 | Attorney | |
| Zolla William | $575,000 | Multiple | |
| Liljedahl Nancy J | $304,000 | -- |
Source: Public Records
Mortgage History
| Date | Status | Borrower | Loan Amount |
|---|---|---|---|
| Open | Howanski Kenneth | $544,000 | |
| Previous Owner | Zolla William | $455,000 | |
| Previous Owner | Liljedahl Nancy J | $220,000 |
Source: Public Records
Tax History Compared to Growth
Tax History
| Year | Tax Paid | Tax Assessment Tax Assessment Total Assessment is a certain percentage of the fair market value that is determined by local assessors to be the total taxable value of land and additions on the property. | Land | Improvement |
|---|---|---|---|---|
| 2024 | $13,648 | $84,000 | $35,820 | $48,180 |
| 2023 | $13,283 | $68,000 | $28,800 | $39,200 |
| 2022 | $13,283 | $68,000 | $28,800 | $39,200 |
| 2021 | $13,005 | $68,000 | $28,800 | $39,200 |
| 2020 | $11,880 | $56,430 | $15,120 | $41,310 |
| 2019 | $12,459 | $62,011 | $15,120 | $46,891 |
| 2018 | $12,249 | $62,011 | $15,120 | $46,891 |
| 2017 | $9,699 | $48,428 | $12,960 | $35,468 |
| 2016 | $9,199 | $48,428 | $12,960 | $35,468 |
| 2015 | $8,394 | $48,428 | $12,960 | $35,468 |
| 2014 | $7,581 | $43,430 | $9,360 | $34,070 |
| 2013 | $7,421 | $43,430 | $9,360 | $34,070 |
Source: Public Records
Map
Nearby Homes
- 2248 W Ainslie St
- 4814 N Damen Ave Unit 209
- 2135 W Leland Ave
- 2224 W Eastwood Ave
- 4906 N Winchester Ave
- 4726 N Winchester Ave Unit C
- 4726 N Winchester Ave Unit F
- 1949 W Argyle St Unit 19491
- 4948 N Winchester Ave
- 5015 N Damen Ave
- 4700 N Western Ave Unit 4B
- 5011 N Western Ave
- 2201 W Winona St Unit 2201G
- 4909 N Wolcott Ave Unit 2B
- 4947 N Wolcott Ave Unit 1B
- 5058 N Claremont Ave Unit 2E
- 5401-5447 N Wolcott Ave
- 4929 N Wolcott Ave Unit 1A
- 2034 W Sunnyside Ave
- 5013 N Wolcott Ave Unit 3W
- 4826 N Hamilton Ave
- 4818 N Hamilton Ave Unit 1
- 4818 N Hamilton Ave
- 4830 N Hamilton Ave
- 4832 N Hamilton Ave
- 4834 N Hamilton Ave
- 4836 N Hamilton Ave
- 4831 N Leavitt St
- 4838 N Hamilton Ave
- 2140 W Lawrence Ave
- 2140 W Lawrence Ave Unit 305
- 4821 N Leavitt St Unit 1
- 4825 N Leavitt St Unit 1
- 4825 N Leavitt St
- 4827 N Leavitt St
- 4817 N Leavitt St
- 4815 N Leavitt St
- 4815 N Leavitt St Unit 2
- 4833 N Leavitt St
- 4840 N Hamilton Ave