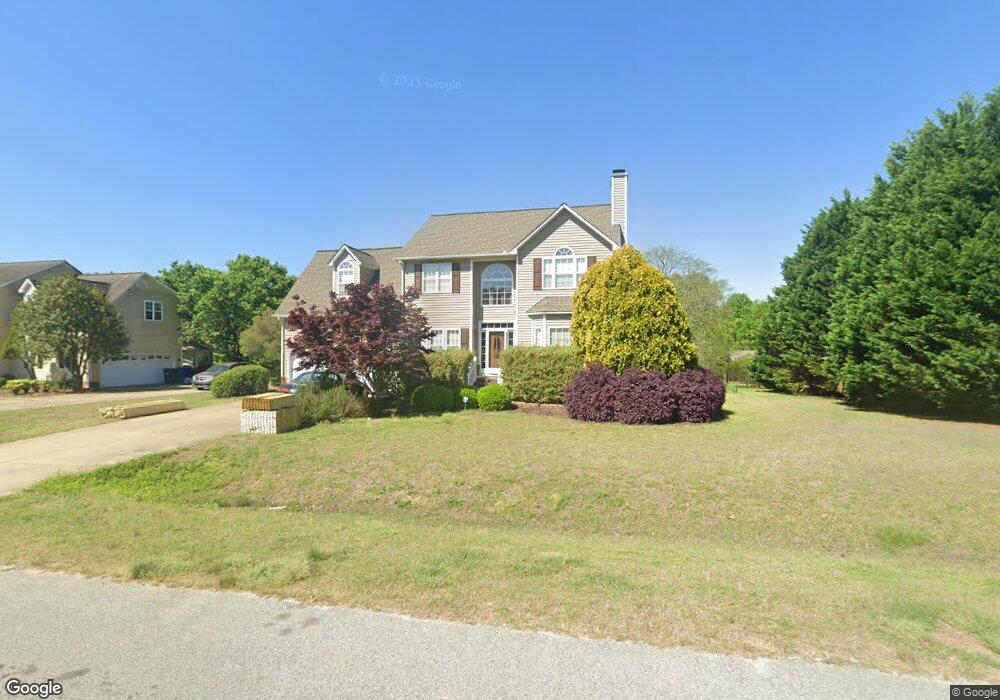
4824 Topstone Rd Raleigh, NC 27603
Estimated Value: $428,000 - $482,000
3
Beds
3
Baths
2,324
Sq Ft
$193/Sq Ft
Est. Value
About This Home
This home is located at 4824 Topstone Rd, Raleigh, NC 27603 and is currently estimated at $449,044, approximately $193 per square foot. 4824 Topstone Rd is a home located in Wake County with nearby schools including Rand Road Elementary, North Garner Middle, and South Garner High.
Ownership History
Date
Name
Owned For
Owner Type
Purchase Details
Closed on
May 17, 2013
Sold by
Stallard Scott D and Stallard Megan D
Bought by
Murdock Daniel K and Murdock Michele P
Current Estimated Value
Home Financials for this Owner
Home Financials are based on the most recent Mortgage that was taken out on this home.
Original Mortgage
$190,000
Outstanding Balance
$135,118
Interest Rate
3.56%
Mortgage Type
New Conventional
Estimated Equity
$313,926
Purchase Details
Closed on
Jun 9, 2006
Sold by
Seales Alan and Seales Susan Beth
Bought by
Stallard Scott D and Stallard Megan D
Home Financials for this Owner
Home Financials are based on the most recent Mortgage that was taken out on this home.
Original Mortgage
$195,000
Interest Rate
6.5%
Mortgage Type
Purchase Money Mortgage
Purchase Details
Closed on
May 14, 2003
Sold by
Comfort Homes Inc
Bought by
Seales Alan
Home Financials for this Owner
Home Financials are based on the most recent Mortgage that was taken out on this home.
Original Mortgage
$146,000
Interest Rate
5.76%
Mortgage Type
Purchase Money Mortgage
Purchase Details
Closed on
Feb 6, 2003
Sold by
Highland Subdivision Inc
Bought by
Comfort Homes Inc
Create a Home Valuation Report for This Property
The Home Valuation Report is an in-depth analysis detailing your home's value as well as a comparison with similar homes in the area
Home Values in the Area
Average Home Value in this Area
Purchase History
| Date | Buyer | Sale Price | Title Company |
|---|---|---|---|
| Murdock Daniel K | $202,000 | None Available | |
| Stallard Scott D | $195,000 | None Available | |
| Seales Alan | $182,500 | -- | |
| Comfort Homes Inc | $195,000 | -- |
Source: Public Records
Mortgage History
| Date | Status | Borrower | Loan Amount |
|---|---|---|---|
| Open | Murdock Daniel K | $190,000 | |
| Previous Owner | Stallard Scott D | $195,000 | |
| Previous Owner | Seales Alan | $146,000 | |
| Closed | Seales Alan | $36,500 |
Source: Public Records
Tax History Compared to Growth
Tax History
| Year | Tax Paid | Tax Assessment Tax Assessment Total Assessment is a certain percentage of the fair market value that is determined by local assessors to be the total taxable value of land and additions on the property. | Land | Improvement |
|---|---|---|---|---|
| 2025 | $2,643 | $410,094 | $115,000 | $295,094 |
| 2024 | $2,567 | $423,507 | $115,000 | $308,507 |
| 2023 | $2,080 | $264,162 | $40,000 | $224,162 |
| 2022 | $1,928 | $264,162 | $40,000 | $224,162 |
| 2021 | $1,876 | $264,162 | $40,000 | $224,162 |
| 2020 | $1,845 | $264,162 | $40,000 | $224,162 |
| 2019 | $1,845 | $223,506 | $40,000 | $183,506 |
| 2018 | $1,697 | $223,506 | $40,000 | $183,506 |
| 2017 | $1,609 | $223,506 | $40,000 | $183,506 |
| 2016 | $1,577 | $223,506 | $40,000 | $183,506 |
| 2015 | $1,458 | $207,029 | $34,000 | $173,029 |
| 2014 | -- | $207,029 | $34,000 | $173,029 |
Source: Public Records
Map
Nearby Homes
- 920 Shadywood Ln
- 1116 Shadywood Ln
- 10001 Joe Leach Rd
- 5013 Contender Dr
- 4721 Sandy Bay Cir
- 8500 Old Ponderosa Cir
- 9505 Neils Branch Rd
- 4117 Bashford Bluffs Ln
- 701 Rand Rd
- 9017 Hunterfox Ct
- 700 Arbor Greene Dr
- 316 Arbor Greene Dr
- 1101 Robinfield Dr
- 8001 Lakeshore Dr
- 901 Edgewater Dr
- 449 Kings Hollow Dr
- 1009 Feldmen Dr
- 1004 Cabin Hill Way
- 1559 Upchurch Woods Dr
- 212 Bluefield Dr
- 4828 Topstone Rd
- 1016 Rockwell Ct
- 1012 Rockwell Ct
- 1000 Rockwell Ct
- 4832 Topstone Rd
- 4825 Topstone Rd
- 4821 Topstone Rd
- 4829 Topstone Rd
- 4817 Topstone Rd
- 1001 Rockwell Ct
- 4836 Topstone Rd
- 4833 Topstone Rd
- 1101 Linden Crest Rd
- 4808 Topstone Rd
- 4813 Topstone Rd
- 1013 Rockwell Ct
- 1009 Rockwell Ct
- 1005 Rockwell Ct
- 4837 Topstone Rd
- 4840 Topstone Rd