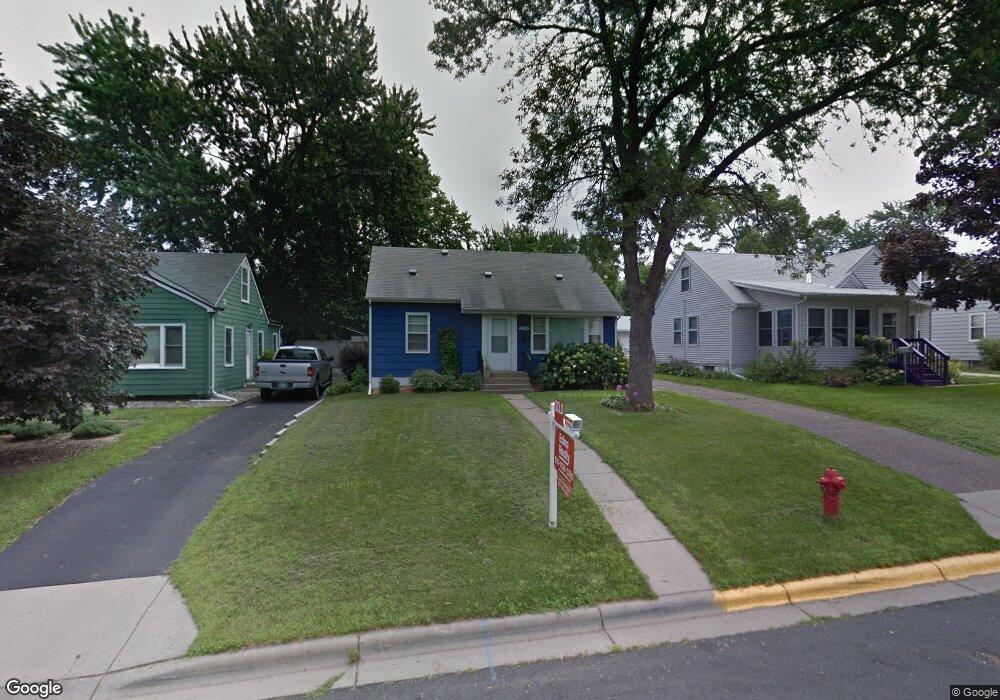
4825 E Upland Crest Columbia Heights, MN 55421
Estimated Value: $279,399 - $309,000
3
Beds
1
Bath
980
Sq Ft
$298/Sq Ft
Est. Value
About This Home
This home is located at 4825 E Upland Crest, Columbia Heights, MN 55421 and is currently estimated at $292,100, approximately $298 per square foot. 4825 E Upland Crest is a home located in Anoka County with nearby schools including Highland Elementary School.
Ownership History
Date
Name
Owned For
Owner Type
Purchase Details
Closed on
Jul 17, 2017
Sold by
Orttel Evie M
Bought by
Kittelson Adam and Rossi Carrilyn
Current Estimated Value
Home Financials for this Owner
Home Financials are based on the most recent Mortgage that was taken out on this home.
Original Mortgage
$187,097
Outstanding Balance
$154,844
Interest Rate
3.75%
Mortgage Type
FHA
Estimated Equity
$137,256
Purchase Details
Closed on
Aug 18, 2011
Sold by
Heymans Mark and Miyahira Yoneko
Bought by
Orttel Evie M
Home Financials for this Owner
Home Financials are based on the most recent Mortgage that was taken out on this home.
Original Mortgage
$110,090
Interest Rate
4.58%
Mortgage Type
FHA
Purchase Details
Closed on
Aug 5, 2010
Sold by
Deutsche Bank National Trust Co
Bought by
Heymans Mark
Purchase Details
Closed on
Jul 24, 1998
Sold by
Loucks James D and Loucks Leah A
Bought by
Krueger Jeromy J and Krueger Joanne M
Create a Home Valuation Report for This Property
The Home Valuation Report is an in-depth analysis detailing your home's value as well as a comparison with similar homes in the area
Home Values in the Area
Average Home Value in this Area
Purchase History
| Date | Buyer | Sale Price | Title Company |
|---|---|---|---|
| Kittelson Adam | $190,551 | Burnet Title | |
| Orttel Evie M | $118,400 | -- | |
| Heymans Mark | $84,100 | -- | |
| Krueger Jeromy J | $91,888 | -- |
Source: Public Records
Mortgage History
| Date | Status | Borrower | Loan Amount |
|---|---|---|---|
| Open | Kittelson Adam | $187,097 | |
| Previous Owner | Orttel Evie M | $110,090 |
Source: Public Records
Tax History Compared to Growth
Tax History
| Year | Tax Paid | Tax Assessment Tax Assessment Total Assessment is a certain percentage of the fair market value that is determined by local assessors to be the total taxable value of land and additions on the property. | Land | Improvement |
|---|---|---|---|---|
| 2025 | $3,152 | $241,100 | $95,500 | $145,600 |
| 2024 | $3,152 | $236,800 | $95,500 | $141,300 |
| 2023 | $2,822 | $254,600 | $95,500 | $159,100 |
| 2022 | $2,520 | $254,100 | $93,600 | $160,500 |
| 2021 | $2,894 | $199,700 | $71,100 | $128,600 |
| 2020 | $2,496 | $185,800 | $69,800 | $116,000 |
| 2019 | $2,313 | $195,100 | $68,400 | $126,700 |
| 2018 | $2,290 | $177,800 | $0 | $0 |
| 2017 | $1,869 | $168,600 | $0 | $0 |
| 2016 | $1,869 | $135,100 | $0 | $0 |
| 2015 | $1,709 | $135,100 | $61,000 | $74,100 |
| 2014 | -- | $109,000 | $45,600 | $63,400 |
Source: Public Records
Map
Nearby Homes
- 2209 Forest Dr NE
- 2792 Forest Dale Rd
- 1630 49th Ave NE
- 747 Redwood Ln
- 762 Silver Lake Rd NW
- 2391 7th St NW
- 650 23rd Ave NW
- 2303 3rd St NW
- 1112 Pecks Woods Dr Unit 112
- 566 Fairfield Dr NW
- 5230 Lincoln St NE
- 4333 Arthur St NE
- 5444 W Bavarian Pass
- 5503 E Bavarian Pass
- 1543 W Bavarian Ct
- 5516 E Bavarian Pass
- 20 Windsor Ln Unit 111A
- 10 Windsor Ct Unit 102
- 5527 E Bavarian Pass
- 5080 Mulcare Dr
- 4833 E Upland Crest
- 4819 E Upland Crest
- 4837 E Upland Crest
- 4813 E Upland Crest
- 4813 E Upland Crescent
- 4843 E Upland Crest
- 2226 Highland Place Unit 2
- 2227 Highland Place
- 4809 E Upland Crest
- 4824 Stinson Blvd
- 4832 Stinson Blvd
- 4818 Stinson Blvd
- 2220 Highland Place
- 4836 Stinson Blvd
- 2221 Highland Place
- 4849 E Upland Crest
- 4812 Stinson Blvd
- 4805 E Upland Crest
- 4842 Stinson Blvd
- 4808 Stinson Blvd