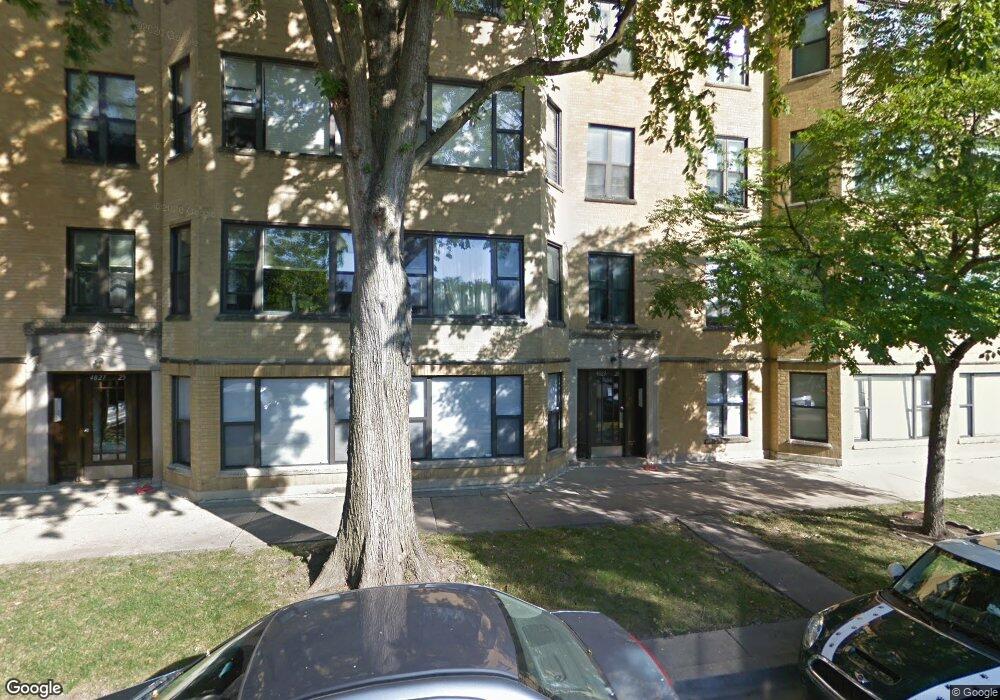
4825 N Fairfield Ave Unit 4825 Chicago, IL 60625
Lincoln Square NeighborhoodEstimated Value: $317,000 - $406,000
2
Beds
--
Bath
--
Sq Ft
0.35
Acres
About This Home
This home is located at 4825 N Fairfield Ave Unit 4825, Chicago, IL 60625 and is currently estimated at $364,652. 4825 N Fairfield Ave Unit 4825 is a home located in Cook County with nearby schools including Budlong Elementary School, Amundsen High School, and North Shore Adventist Academy.
Ownership History
Date
Name
Owned For
Owner Type
Purchase Details
Closed on
May 10, 2021
Sold by
Sugent Lauren A and Chodak Michael
Bought by
Murji Tessine
Current Estimated Value
Home Financials for this Owner
Home Financials are based on the most recent Mortgage that was taken out on this home.
Original Mortgage
$239,920
Interest Rate
3.12%
Mortgage Type
New Conventional
Purchase Details
Closed on
Apr 16, 2004
Sold by
Wargin Lisa M
Bought by
Sugent Lauren A
Home Financials for this Owner
Home Financials are based on the most recent Mortgage that was taken out on this home.
Original Mortgage
$145,500
Interest Rate
4.25%
Mortgage Type
Unknown
Purchase Details
Closed on
Jun 28, 1999
Sold by
Real Concord Inc
Bought by
Wargin Lisa M
Home Financials for this Owner
Home Financials are based on the most recent Mortgage that was taken out on this home.
Original Mortgage
$111,000
Interest Rate
7.29%
Create a Home Valuation Report for This Property
The Home Valuation Report is an in-depth analysis detailing your home's value as well as a comparison with similar homes in the area
Home Values in the Area
Average Home Value in this Area
Purchase History
| Date | Buyer | Sale Price | Title Company |
|---|---|---|---|
| Murji Tessine | $300,000 | Chicago Title | |
| Sugent Lauren A | $225,500 | Multiple | |
| Wargin Lisa M | $139,000 | -- |
Source: Public Records
Mortgage History
| Date | Status | Borrower | Loan Amount |
|---|---|---|---|
| Previous Owner | Murji Tessine | $239,920 | |
| Previous Owner | Sugent Lauren A | $145,500 | |
| Previous Owner | Wargin Lisa M | $111,000 |
Source: Public Records
Tax History Compared to Growth
Tax History
| Year | Tax Paid | Tax Assessment Tax Assessment Total Assessment is a certain percentage of the fair market value that is determined by local assessors to be the total taxable value of land and additions on the property. | Land | Improvement |
|---|---|---|---|---|
| 2024 | $5,275 | $26,332 | $1,789 | $24,543 |
| 2023 | $5,142 | $25,001 | $1,210 | $23,791 |
| 2022 | $5,142 | $25,001 | $1,210 | $23,791 |
| 2021 | $4,357 | $24,999 | $1,209 | $23,790 |
| 2020 | $4,221 | $22,049 | $1,209 | $20,840 |
| 2019 | $4,198 | $24,324 | $1,209 | $23,115 |
| 2018 | $4,126 | $24,324 | $1,209 | $23,115 |
| 2017 | $3,191 | $18,197 | $1,058 | $17,139 |
| 2016 | $3,145 | $18,197 | $1,058 | $17,139 |
| 2015 | $2,854 | $18,197 | $1,058 | $17,139 |
| 2014 | $2,879 | $18,086 | $982 | $17,104 |
| 2013 | $2,811 | $18,086 | $982 | $17,104 |
Source: Public Records
Map
Nearby Homes
- 2709 W Lawrence Ave Unit 3
- 4755 N Washtenaw Ave Unit P-27
- 4755 N Washtenaw Ave Unit P-25
- 4755 N Washtenaw Ave Unit P-11
- 2754 W Giddings St
- 4850 N Rockwell St
- 4904 N Rockwell St Unit 2N
- 2540 W Leland Ave Unit 2
- 2527 W Argyle St
- 2607 W Carmen Ave
- 2700 W Carmen Ave
- 3000 W Lawrence Ave Unit 3H
- 4701 N Campbell Ave Unit 2
- 2455 W Leland Ave Unit 1
- 4751 N Artesian Ave Unit 205
- 4751 N Artesian Ave Unit 409
- 2505 W Carmen Ave Unit 303
- 2602 W Winona St
- 5061 N Lincoln Ave Unit 201
- 4920 N Whipple St Unit 1
- 2719 W Gunnison St Unit 2
- 4821 N Fairfield Ave Unit 1
- 4825 N Fairfield Ave Unit 2
- 4825 N Fairfield Ave Unit 4825
- 4817 N Fairfield Ave Unit 4817
- 4821 N Fairfield Ave Unit 4821
- 4823 N Fairfield Ave Unit 4823
- 4823 N Fairfield Ave Unit 4823
- 4821 N Fairfield Ave Unit 4821
- 2719 W Gunnison St Unit 2719GD
- 4817 N Fairfield Ave Unit 4817
- 4821 N Fairfield Ave Unit 4821
- 4817 N Fairfield Ave Unit 4817
- 4825 N Fairfield Ave Unit 4825
- 2719 W Gunnison St Unit 27191
- 2719 W Gunnison St Unit 27193
- 4823 N Fairfield Ave Unit 4823
- 4825 N Fairfield Ave Unit 4825
- 4817 N Fairfield Ave Unit 4817
- 4823 N Fairfield Ave Unit 3