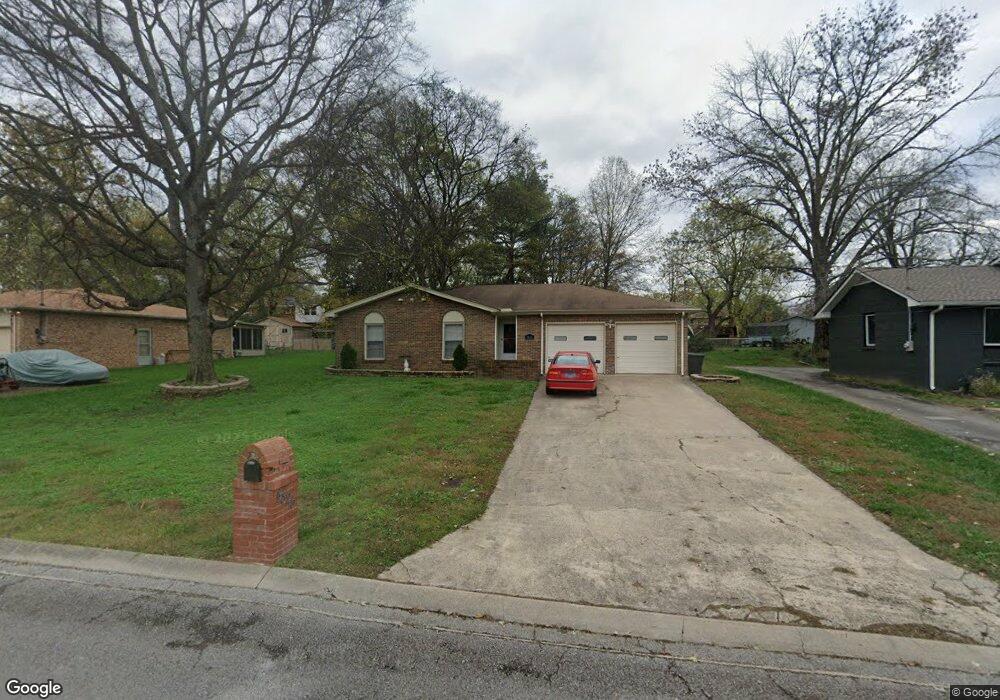
4825 Smokey Dr Old Hickory, TN 37138
Hermitage NeighborhoodEstimated Value: $337,000 - $372,000
3
Beds
2
Baths
1,228
Sq Ft
$285/Sq Ft
Est. Value
About This Home
This home is located at 4825 Smokey Dr, Old Hickory, TN 37138 and is currently estimated at $350,044, approximately $285 per square foot. 4825 Smokey Dr is a home located in Davidson County with nearby schools including Andrew Jackson Elementary School, Dupont-Hadley Middle School, and McGavock High School.
Ownership History
Date
Name
Owned For
Owner Type
Purchase Details
Closed on
Nov 18, 2016
Sold by
Writh Kayla N and Walker Ii John F
Bought by
Borruso Savannah R
Current Estimated Value
Home Financials for this Owner
Home Financials are based on the most recent Mortgage that was taken out on this home.
Original Mortgage
$135,500
Outstanding Balance
$107,742
Interest Rate
3.12%
Mortgage Type
FHA
Estimated Equity
$242,303
Purchase Details
Closed on
Dec 31, 2014
Sold by
Edwards James P and Edwards Ann C
Bought by
Wright Kayla N and Walker Ii John F
Home Financials for this Owner
Home Financials are based on the most recent Mortgage that was taken out on this home.
Original Mortgage
$130,787
Interest Rate
4.37%
Mortgage Type
FHA
Purchase Details
Closed on
Sep 29, 2014
Sold by
Edwards James P and Edwards Ann C
Bought by
Edwards James P and Edwards Ann C
Purchase Details
Closed on
Nov 18, 2013
Sold by
Edwards James P
Bought by
Edwards James P and Edwards Ann C
Purchase Details
Closed on
Dec 31, 1998
Sold by
Danny F Dunn & James P Edwards Prtnrshp
Bought by
Edwards James P
Create a Home Valuation Report for This Property
The Home Valuation Report is an in-depth analysis detailing your home's value as well as a comparison with similar homes in the area
Home Values in the Area
Average Home Value in this Area
Purchase History
| Date | Buyer | Sale Price | Title Company |
|---|---|---|---|
| Borruso Savannah R | $138,000 | None Available | |
| Wright Kayla N | $133,200 | Bell & Alexander Title Svcs | |
| Edwards James P | -- | None Available | |
| Edwards James P | -- | None Available | |
| Edwards James P | -- | -- |
Source: Public Records
Mortgage History
| Date | Status | Borrower | Loan Amount |
|---|---|---|---|
| Open | Borruso Savannah R | $135,500 | |
| Previous Owner | Wright Kayla N | $130,787 |
Source: Public Records
Tax History Compared to Growth
Tax History
| Year | Tax Paid | Tax Assessment Tax Assessment Total Assessment is a certain percentage of the fair market value that is determined by local assessors to be the total taxable value of land and additions on the property. | Land | Improvement |
|---|---|---|---|---|
| 2024 | $1,637 | $56,025 | $12,500 | $43,525 |
| 2023 | $1,637 | $56,025 | $12,500 | $43,525 |
| 2022 | $1,637 | $56,025 | $12,500 | $43,525 |
| 2021 | $1,654 | $56,025 | $12,500 | $43,525 |
| 2020 | $1,486 | $39,225 | $8,750 | $30,475 |
| 2019 | $1,081 | $39,225 | $8,750 | $30,475 |
| 2018 | $1,081 | $39,225 | $8,750 | $30,475 |
| 2017 | $1,081 | $39,225 | $8,750 | $30,475 |
| 2016 | $1,083 | $27,600 | $6,250 | $21,350 |
| 2015 | $1,083 | $27,600 | $6,250 | $21,350 |
| 2014 | $1,083 | $27,600 | $6,250 | $21,350 |
Source: Public Records
Map
Nearby Homes
- 4837 Matterhorn Dr
- 4924 Whittier Dr
- 4840 Shasta Dr
- 4852 Everest Dr
- 4610 Woodside Dr
- 1033 Wyntergrace Farm Rd
- 4768 Cascade Dr
- 1320 Autumn Springs Ln
- 4741 Cascade Dr
- 104 Saddle Tree Ct
- 1884 Brookmeadow Ln
- 604 Weatherbeaten Place Unit 604
- 22 Shshone Ct
- 220 Harpers Mill Ct Unit 220
- 2309 Crescent Valley Place
- 222 Blue Ridge Dr
- 1869 Brookmeadow Ln
- 310 Santa Rosa Dr
- 116 Greenwich Ct
- 290 Brookside Dr