NOT LISTED FOR SALE

4826 4826 191st-Street-w Farmington, MN 55024

Estimated Value: $401,000 - $447,000

3 Beds
3 Baths
1,676 Sq Ft
$252/Sq Ft Est. Value

Last Sold November 19, 2012

Last sale price $195,500 $117 Per Sq Ft

Est. 116% increase in value since last sale

Current estimated payment $2,616/month

About This Home

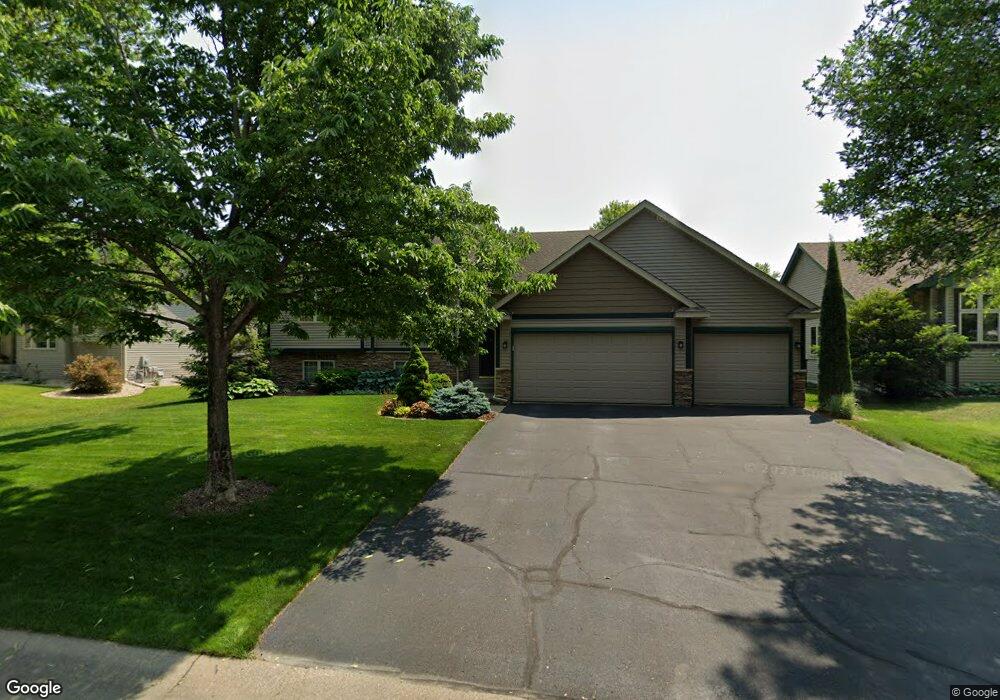
Great 3 Bdrm home - open feel. Can Build equity and space - unfinished Basement. Brand new Timberline 30 year roof. Well maintained. Move in Ready! Back on market.

Ownership History

Date Name Owned For Owner Type

Purchase Details

Listed on
Jan 16, 2012
Closed on
Nov 19, 2012
Sold by
Loberg Joel P and Loberg Angela M
Bought by
Nord Mark J
Seller's Agent
Michelle Hoagland
Keller Williams Preferred Rlty
Buyer's Agent
Phillip Beaumia
Executive Realty
List Price
$210,000
Sold Price
$195,500
Premium/Discount to List
-$14,500
-6.9%
Current Estimated Value
$422,074

Home Financials for this Owner

Home Financials are based on the most recent Mortgage that was taken out on this home.
Estimated Appreciation
$226,574
Avg. Annual Appreciation
6.12%
Original Mortgage
$156,400
Interest Rate
3.31%
Mortgage Type
New Conventional

Purchase Details

Closed on
Aug 7, 2001
Sold by
J L Wageman Homes
Bought by
Loberg Joel and Loberg Angela

Purchase Details

Closed on
Feb 27, 2001
Sold by
Arcon Development Inc
Bought by
J L Wageman Homes Inc
Source: Public Records

Range of Values:

Collateral Analytics

Collateral Analytics Collateral Analytics AVMs (Automated Valuation Model) employ a number of statistical approaches combined with neighborhood-specific comparable selection guarantees the most up-to-date and precise valuations.

Not Available

Collateral Analytics does not have data for the current month. Please view the chart for historical values.

ICE

ICE Mortgage Technology ICE Mortgage Technology’s AVM (Automated Valuation Model) is a state-of-the-art online residential property valuation tool that provides a quick and accurate estimate of the value of almost any home in the U.S.

Not Available

ICE Mortgage Technology does not have data for the current month. Please view the chart for historical values.

First American

First American First American Data & Analytics’ next-generation AVM combines unrivaled data assets with a blended ensemble of valuation models to produce highly accurate, reliable valuations you can trust.

Not Available

First American does not have data for the current month. Please view the chart for historical values.

Quantarium

Quantarium Quantarium’s valuation service, repeatedly proven the industry’s most accurate and comprehensive, is supercharged with a self-learning and auto-tuning AI engine that continually becomes smarter and more accurate as it processes daily inputs from the industry’s leading RE data lake.

Not Available

Quantarium does not have data for the current month. Please view the chart for historical values.

Average Value
Not Available
List Price
Sold Price
Create a Home Valuation Report for This Property
The Home Valuation Report is an in-depth analysis detailing your home's value as well as a comparison with similar homes in the area

Home Values in the Area

Source: Public Records

Average Home Value in this Area


Source: Public Records

Purchase History

Date Buyer Sale Price Title Company
Nord Mark J $195,500 Title Support Services
Loberg Joel $225,000 --
J L Wageman Homes Inc $48,900 --
Source: Public Records

Mortgage History

Date Status Borrower Loan Amount
Previous Owner Nord Mark J $156,400
Source: Public Records

Property History

Date Event Price List to Sale Price per Sq Ft Prior Sale
11/19/2012 11/19/12 Sold $195,500 -6.9% $116 / Sq Ft View Prior Sale
11/06/2012 11/06/12 Pending -- -- --
01/16/2012 01/16/12 For Sale $210,000 -- $125 / Sq Ft

Tax History Compared to Growth

Source: Public Records

Tax History

Year Tax Paid Tax Assessment Tax Assessment Total Assessment is a certain percentage of the fair market value that is determined by local assessors to be the total taxable value of land and additions on the property. Land Improvement
2024 $4,748 $374,200 $99,600 $274,600
2023 $4,748 $391,600 $99,800 $291,800
2022 $4,236 $365,600 $99,500 $266,100
2021 $4,052 $305,400 $86,600 $218,800
2020 $4,212 $291,100 $82,400 $208,700
2019 $4,327 $290,500 $78,500 $212,000
2018 $4,050 $292,200 $75,000 $217,200
2017 $4,035 $267,600 $71,400 $196,200
2016 $3,830 $259,600 $67,900 $191,700
2015 $3,273 $225,886 $61,384 $164,502
2014 -- $203,541 $56,391 $147,150
2013 -- $196,456 $50,397 $146,059
Source: Public Records

Agents Affiliated with this Home

See All Agents

Map