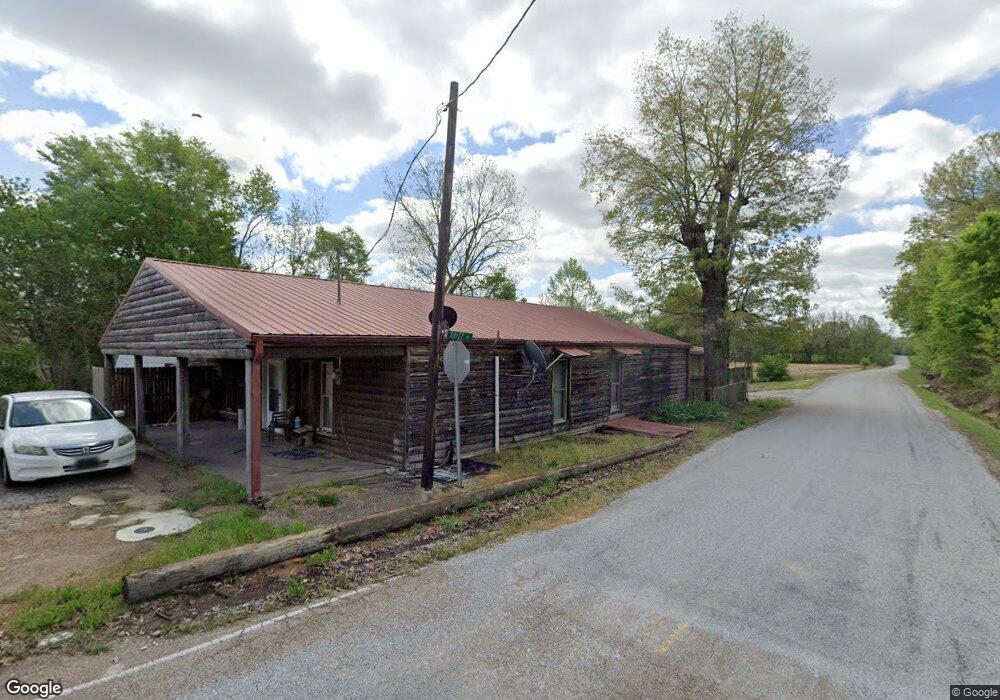
4826 Us Highway 70 E Brownsville, TN 38012
Estimated Value: $117,149 - $219,000
--
Bed
1
Bath
3,309
Sq Ft
$47/Sq Ft
Est. Value
About This Home
This home is located at 4826 Us Highway 70 E, Brownsville, TN 38012 and is currently estimated at $155,787, approximately $47 per square foot. 4826 Us Highway 70 E is a home located in Haywood County with nearby schools including Anderson Early Childhood Center, East Side Elementary School, and Haywood Elementary School.
Ownership History
Date
Name
Owned For
Owner Type
Purchase Details
Closed on
Jul 29, 2022
Sold by
Denise Phillips C
Bought by
Conner Justin
Current Estimated Value
Home Financials for this Owner
Home Financials are based on the most recent Mortgage that was taken out on this home.
Original Mortgage
$88,860
Outstanding Balance
$85,023
Interest Rate
5.78%
Mortgage Type
FHA
Estimated Equity
$70,764
Purchase Details
Closed on
Jan 30, 2001
Sold by
Doyle Ellington V
Bought by
Phillips Jimmy L
Purchase Details
Closed on
Feb 24, 1999
Sold by
Kennedy Stanley E
Bought by
Doyle Ellington V and Doyle Linda
Purchase Details
Closed on
Oct 11, 1994
Bought by
Kennedy Stanley E
Purchase Details
Closed on
Feb 11, 1994
Bought by
Autry Dwayne
Purchase Details
Closed on
Oct 5, 1992
Bought by
Saveh William
Purchase Details
Closed on
Mar 6, 1985
Bought by
Porch Lonnie E and Porch Peggy
Purchase Details
Closed on
Jan 31, 1975
Create a Home Valuation Report for This Property
The Home Valuation Report is an in-depth analysis detailing your home's value as well as a comparison with similar homes in the area
Home Values in the Area
Average Home Value in this Area
Purchase History
| Date | Buyer | Sale Price | Title Company |
|---|---|---|---|
| Conner Justin | $90,500 | Shearon Joshua B | |
| Conner Justin | $90,500 | Shearon Joshua B | |
| Phillips Jimmy L | $100,000 | -- | |
| Doyle Ellington V | $35,000 | -- | |
| Kennedy Stanley E | $40,000 | -- | |
| Autry Dwayne | $40,000 | -- | |
| Saveh William | -- | -- | |
| Porch Lonnie E | -- | -- | |
| -- | -- | -- |
Source: Public Records
Mortgage History
| Date | Status | Borrower | Loan Amount |
|---|---|---|---|
| Open | Conner Justin | $88,860 | |
| Closed | Conner Justin | $88,860 |
Source: Public Records
Tax History Compared to Growth
Tax History
| Year | Tax Paid | Tax Assessment Tax Assessment Total Assessment is a certain percentage of the fair market value that is determined by local assessors to be the total taxable value of land and additions on the property. | Land | Improvement |
|---|---|---|---|---|
| 2025 | $564 | $29,250 | $0 | $0 |
| 2024 | $564 | $29,250 | $1,900 | $27,350 |
| 2023 | $493 | $17,875 | $1,725 | $16,150 |
| 2022 | $493 | $17,875 | $1,725 | $16,150 |
| 2021 | $493 | $17,875 | $1,725 | $16,150 |
| 2020 | $486 | $17,625 | $1,725 | $15,900 |
| 2019 | $486 | $17,625 | $1,725 | $15,900 |
| 2018 | $629 | $21,875 | $1,500 | $20,375 |
| 2017 | $629 | $21,875 | $1,500 | $20,375 |
| 2016 | $580 | $21,875 | $1,500 | $20,375 |
| 2015 | $580 | $21,875 | $1,500 | $20,375 |
| 2014 | $529 | $22,075 | $1,500 | $20,575 |
Source: Public Records
Map
Nearby Homes
- 135 Davis Rd
- 77 Upper Zion Rd
- 855 Springfield Rd
- 1450 Friendship Rd
- 470 Marbury Rd
- 0 Deerfield Cove Unit 2504512
- 2902 Us Highway 79 N
- 5596 79 Hwy N
- 00 Route 76
- 2397 U S 79
- 736 Tippett Ln
- 1295 Anderson Ave
- 2267 Anderson Ave
- 1114 Warren St
- 917 Anderson Ave Unit A
- 930 Gray St
- 703 Cottonwood Dr
- 103 N Bond Ave
- 105 N Bond Ave
- 411 N Bond Ave
- 00 Tritt Rd
- 4876 Us Highway 70 E
- 4876 U S 70
- 4871 Us Highway 70 E
- 85 Bratt Thomas Rd
- 4911 Us Highway 70 E
- 4735 Us Highway 70 E
- 95 Bratt Thomas Rd
- 4665 Us Highway 70 E
- 5035 Us Highway 70 E
- 5068 Us Highway 70 E
- 4545 Us Highway 70 E
- 5157 Us Highway 70 E
- 4579 Us Highway 70 E
- 387 Tritt Rd
- 275 Davis Rd
- 4441 Us Highway 70 E
- 120 Harrell Rd
- 405 Davis Rd
- 5437 Us Highway 70 E