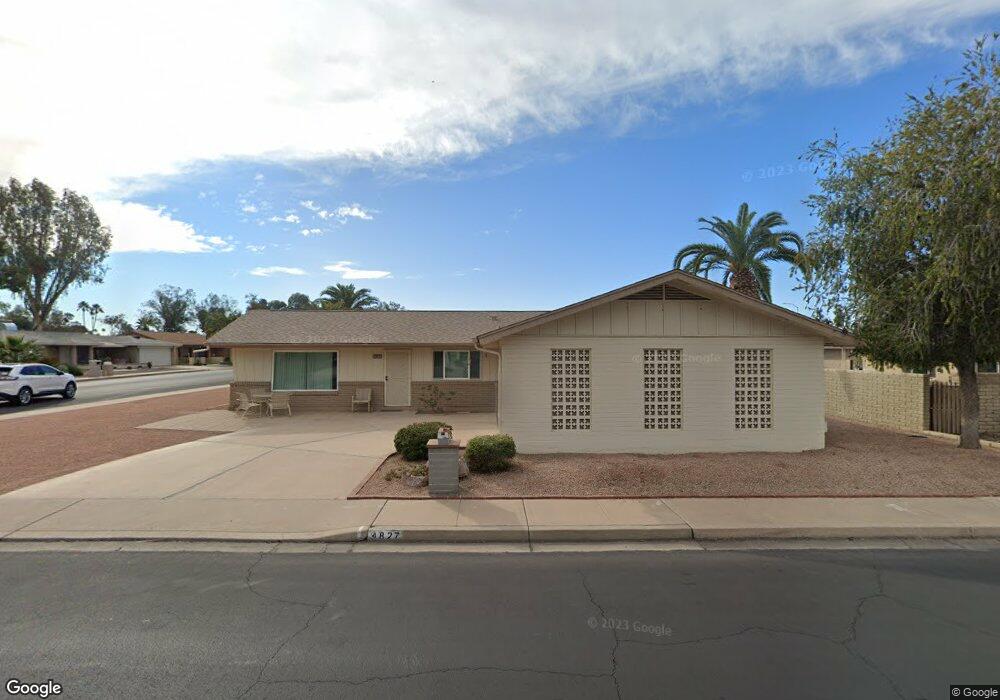
4827 E Delta Ave Mesa, AZ 85206
Sunland Village NeighborhoodEstimated Value: $337,344 - $429,000
Studio
2
Baths
1,750
Sq Ft
$225/Sq Ft
Est. Value
About This Home
This home is located at 4827 E Delta Ave, Mesa, AZ 85206 and is currently estimated at $393,336, approximately $224 per square foot. 4827 E Delta Ave is a home located in Maricopa County with nearby schools including Franklin at Brimhall Elementary School, Madison Elementary School, and Franklin West Elementary School.
Ownership History
Date
Name
Owned For
Owner Type
Purchase Details
Closed on
Jul 26, 2018
Sold by
Scharf Linda S and Carl D Ruth H Scharf Living Tr
Bought by
Scharf Linda S and Linda S Scharf Living Trust
Current Estimated Value
Purchase Details
Closed on
Jun 23, 2004
Sold by
Scharf Carl D and Scharf Ruth H
Bought by
Scharf Carl D and Scharf Ruth H
Purchase Details
Closed on
Feb 23, 2001
Sold by
Colhoun J Melville and Colhoun Evelyn
Bought by
Scharf Carl D and Scharf Ruth H
Purchase Details
Closed on
Mar 5, 1999
Sold by
Colhoun J Melville and Colhoun J
Bought by
Colhoun J Melville and Colhoun J
Purchase Details
Closed on
Jan 28, 1998
Sold by
Leach Arnold O and Leach A
Bought by
Colhoun J Melville and Colhoun J
Purchase Details
Closed on
Nov 11, 1996
Sold by
Cleghorn Beverly B
Bought by
Cleghorn Beverly B and Cleghorn Douglas W
Create a Home Valuation Report for This Property
The Home Valuation Report is an in-depth analysis detailing your home's value as well as a comparison with similar homes in the area
Home Values in the Area
Average Home Value in this Area
Purchase History
| Date | Buyer | Sale Price | Title Company |
|---|---|---|---|
| Scharf Linda S | -- | None Available | |
| Scharf Carl D | -- | -- | |
| Scharf Carl D | $130,000 | Transnation Title Insurance | |
| Colhoun J Melville | -- | Chicago Title Insurance Co | |
| Colhoun J Melville | $150,000 | Chicago Title Insurance Co | |
| Cleghorn Beverly B | -- | -- |
Source: Public Records
Tax History
| Year | Tax Paid | Tax Assessment Tax Assessment Total Assessment is a certain percentage of the fair market value that is determined by local assessors to be the total taxable value of land and additions on the property. | Land | Improvement |
|---|---|---|---|---|
| 2025 | $1,579 | $18,550 | -- | -- |
| 2024 | $1,595 | $17,667 | -- | -- |
| 2023 | $1,595 | $27,600 | $5,520 | $22,080 |
| 2022 | $1,561 | $22,620 | $4,520 | $18,100 |
| 2021 | $1,597 | $19,100 | $3,820 | $15,280 |
| 2020 | $1,574 | $17,770 | $3,550 | $14,220 |
| 2019 | $1,461 | $16,370 | $3,270 | $13,100 |
| 2018 | $1,393 | $15,070 | $3,010 | $12,060 |
| 2017 | $1,351 | $14,220 | $2,840 | $11,380 |
| 2016 | $1,319 | $13,780 | $2,750 | $11,030 |
| 2015 | $1,249 | $12,230 | $2,440 | $9,790 |
Source: Public Records
Map
Nearby Homes
- 829 S Roanoke
- 4758 E Delta Ave
- 4749 E Edgewood Ave
- 913 S Roanoke
- 4709 E Edgewood Ave
- 4654 E Escondido Ave
- 955 S Rochester
- 4632 E Escondido Ave
- 542 S Higley Rd Unit 53
- 542 S Higley Rd Unit 90
- 542 S Higley Rd Unit 54
- 542 S Higley Rd Unit 89
- 542 S Higley Rd Unit 3
- 1025 S Roanoke
- 5057 E Dragoon Ave
- 552 S Rosemont
- 5101 E Elena Ave
- 523 S Roanoke
- 4734 E Florian Cir
- 610 S St Paul
- 801 S Roanoke
- 808 S Rochester
- 805 S Roanoke
- 801 S Rochester
- 4826 E Delta Ave
- 4820 E Delta Ave
- 807 S Rochester
- 816 S Rochester
- 4814 E Delta Ave
- 813 S Roanoke
- 815 S Rochester
- 4765 E Delta Ave
- 4808 E Delta Ave
- 824 S Rochester
- 806 S Roanoke
- 821 S Roanoke
- 823 S Rochester
- 814 S Roanoke
- 4766 E Delta Ave
- 4761 E Delta Ave
Your Personal Tour Guide
Ask me questions while you tour the home.