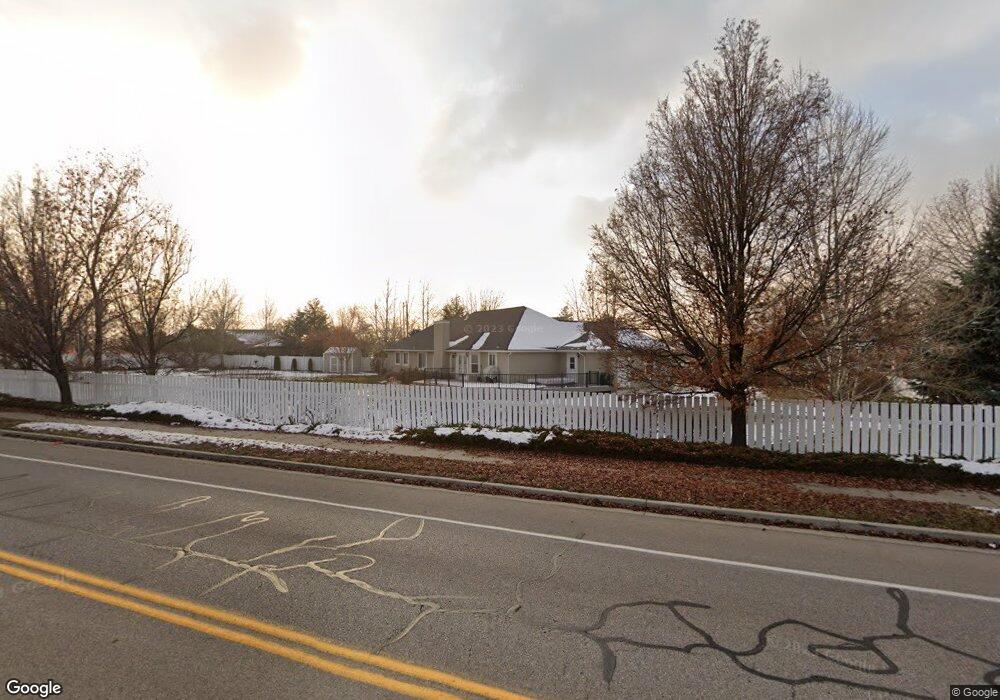
4827 Joey Ct Unit J Highland, UT 84003
Estimated Value: $991,000 - $1,200,000
3
Beds
3
Baths
2,521
Sq Ft
$419/Sq Ft
Est. Value
About This Home
This home is located at 4827 Joey Ct Unit J, Highland, UT 84003 and is currently estimated at $1,057,338, approximately $419 per square foot. 4827 Joey Ct Unit J is a home located in Utah County with nearby schools including Highland Elementary School, Timberline Middle School, and Lone Peak High School.
Ownership History
Date
Name
Owned For
Owner Type
Purchase Details
Closed on
Dec 1, 2020
Sold by
Jensen Criag Alan
Bought by
Jensen Craig Alan and Jensen Kimberly F
Current Estimated Value
Purchase Details
Closed on
Oct 2, 2013
Sold by
Jensen Craig Alan and Jensen Kimberly F
Bought by
Jensen Craig Alan and Jensen Kimberly F
Home Financials for this Owner
Home Financials are based on the most recent Mortgage that was taken out on this home.
Original Mortgage
$160,000
Interest Rate
4.49%
Mortgage Type
New Conventional
Purchase Details
Closed on
Sep 27, 2000
Sold by
Maddox Steven T
Bought by
Jensen Craig A and Jensen Kimberly F
Home Financials for this Owner
Home Financials are based on the most recent Mortgage that was taken out on this home.
Original Mortgage
$163,100
Interest Rate
7.98%
Create a Home Valuation Report for This Property
The Home Valuation Report is an in-depth analysis detailing your home's value as well as a comparison with similar homes in the area
Home Values in the Area
Average Home Value in this Area
Purchase History
| Date | Buyer | Sale Price | Title Company |
|---|---|---|---|
| Jensen Craig Alan | -- | None Available | |
| Jensen Craig Alan | -- | None Available | |
| Jensen Craig A | -- | First American Title Co |
Source: Public Records
Mortgage History
| Date | Status | Borrower | Loan Amount |
|---|---|---|---|
| Closed | Jensen Craig Alan | $160,000 | |
| Closed | Jensen Craig A | $163,100 |
Source: Public Records
Tax History Compared to Growth
Tax History
| Year | Tax Paid | Tax Assessment Tax Assessment Total Assessment is a certain percentage of the fair market value that is determined by local assessors to be the total taxable value of land and additions on the property. | Land | Improvement |
|---|---|---|---|---|
| 2025 | $4,046 | $493,790 | $544,400 | $353,400 |
| 2024 | $4,046 | $499,785 | $0 | $0 |
| 2023 | $3,803 | $506,715 | $0 | $0 |
| 2022 | $4,059 | $524,425 | $0 | $0 |
| 2021 | $3,577 | $688,300 | $329,400 | $358,900 |
| 2020 | $3,419 | $645,300 | $286,400 | $358,900 |
| 2019 | $3,206 | $633,000 | $286,400 | $346,600 |
| 2018 | $3,374 | $633,000 | $286,400 | $346,600 |
| 2017 | $3,178 | $318,230 | $0 | $0 |
| 2016 | $3,056 | $286,000 | $0 | $0 |
| 2015 | $2,885 | $255,970 | $0 | $0 |
| 2014 | -- | $223,795 | $0 | $0 |
Source: Public Records
Map
Nearby Homes
- 5077 W 11000 N
- 682 Healey Blvd
- 5159 W 11000 N
- 868 S Braddock Ln
- 10861 N Panorama Dr
- 629 S Pheasant Ridge Cir
- 5984 W 11200 N Unit 1
- 909 Ridge Ln
- 88 W Cascade Ave
- 4224 W Park Dr
- 5377 W Evergreen Way
- 10685 N Jerling Dr
- 10535 Janie Ln
- 364 E 280 S
- 10763 N Dosh Ln
- 10905 N Vercelli Dr
- Villa A Plan at TEN700
- Villa D Plan at TEN700
- Cottonwood Villa Plan at TEN700
- Villa C Plan at TEN700
- 4843 Joey Ct
- 4828 W Joey Ct
- 4828 W Joey Ct
- 4828 W Joey Ct
- 4842 11240 N
- 11185 N 4800 W
- 11185 N 4800 W Unit 3
- 11185 N 4800 W Unit 5
- 11185 N 4800 W Unit 4
- 11185 N 4800 W Unit 1
- 11222 Sampson Dr
- 4764 W 11200 N
- 11222 N Sampson Dr
- 11192 N 4800 W
- 4845 W 11200 N
- 4864 Joey Ct
- 4864 W Joey Ct
- 4827 11240 N Unit 22
- 11180 N 4800 W
- 11282 N 4880 W Unit 13