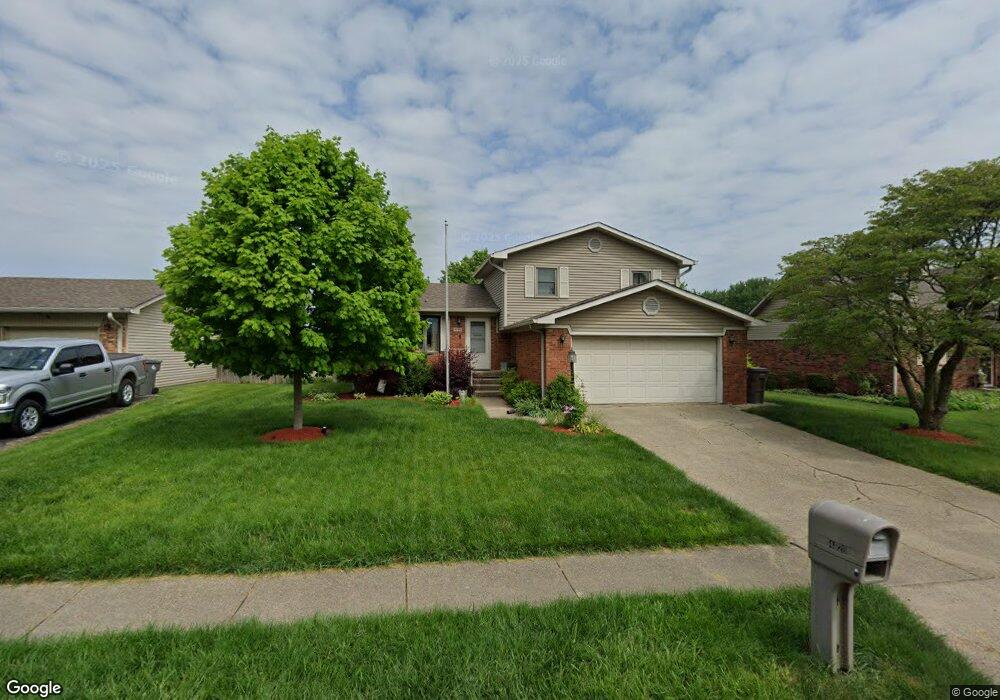
4828 Candy Spots Dr Indianapolis, IN 46237
South Emerson NeighborhoodEstimated Value: $260,000 - $291,818
3
Beds
1
Bath
1,984
Sq Ft
$141/Sq Ft
Est. Value
About This Home
This home is located at 4828 Candy Spots Dr, Indianapolis, IN 46237 and is currently estimated at $280,705, approximately $141 per square foot. 4828 Candy Spots Dr is a home located in Marion County with nearby schools including Franklin Central High School, Gray Road Christian School, and Indianapolis Southside Christian Academy.
Ownership History
Date
Name
Owned For
Owner Type
Purchase Details
Closed on
May 22, 2009
Sold by
Lewis Laurie A and Sweetman Laurie A
Bought by
Lewis Paul A and Lewis Laurie A
Current Estimated Value
Home Financials for this Owner
Home Financials are based on the most recent Mortgage that was taken out on this home.
Original Mortgage
$56,650
Interest Rate
4.94%
Mortgage Type
New Conventional
Create a Home Valuation Report for This Property
The Home Valuation Report is an in-depth analysis detailing your home's value as well as a comparison with similar homes in the area
Home Values in the Area
Average Home Value in this Area
Purchase History
| Date | Buyer | Sale Price | Title Company |
|---|---|---|---|
| Lewis Paul A | -- | None Available |
Source: Public Records
Mortgage History
| Date | Status | Borrower | Loan Amount |
|---|---|---|---|
| Closed | Lewis Paul A | $56,650 |
Source: Public Records
Tax History Compared to Growth
Tax History
| Year | Tax Paid | Tax Assessment Tax Assessment Total Assessment is a certain percentage of the fair market value that is determined by local assessors to be the total taxable value of land and additions on the property. | Land | Improvement |
|---|---|---|---|---|
| 2024 | $3,153 | $277,700 | $26,600 | $251,100 |
| 2023 | $3,153 | $264,400 | $26,600 | $237,800 |
| 2022 | $3,226 | $254,200 | $26,600 | $227,600 |
| 2021 | $2,656 | $209,500 | $26,600 | $182,900 |
| 2020 | $2,453 | $190,500 | $26,600 | $163,900 |
| 2019 | $2,446 | $186,700 | $19,800 | $166,900 |
| 2018 | $2,230 | $168,400 | $19,800 | $148,600 |
| 2017 | $2,073 | $155,400 | $19,800 | $135,600 |
| 2016 | $2,022 | $150,400 | $19,800 | $130,600 |
| 2014 | $1,737 | $137,500 | $19,800 | $117,700 |
| 2013 | $2,931 | $137,500 | $19,800 | $117,700 |
Source: Public Records
Map
Nearby Homes
- 4932 Candy Spots Ct
- 4921 Candy Spots Dr
- 4721 Dancer Dr
- 5223 Bahia Dr
- 5133 La Fleur Way
- 5512 Lunsford Dr
- 6046 Glebe Dr
- 5102 Triple Crown Way
- 5237 Chisolm Trail
- 5106 Triple Crown Way
- 5110 Triple Crown Way
- 5709 Tansy Ct
- 5240 Chisolm Trail
- 5858 Timber Lake Blvd
- 4835 Franklin Villas Dr
- Hulman Plan at Belmont
- Spring Valley Plan at Belmont
- New Castle Plan at Belmont
- Hinkle Plan at Belmont
- Hickory Plan at Belmont
- 4824 Candy Spots Dr
- 4832 Candy Spots Dr
- 4820 Candy Spots Dr
- 5607 Whirlaway Ct
- 5613 Whirlaway Ct
- 5601 Whirlaway Ct
- 4830 Candy Spots Ct
- 4816 Candy Spots Dr
- 5619 Whirlaway Ct
- 4835 Candy Spots Dr
- 4902 Candy Spots Dr
- 4827 Candy Spots Ct
- 4901 Candy Spots Dr
- 4828 Whirlaway Dr
- 4823 Candy Spots Dr
- 4912 Candy Spots Ct
- 4906 Candy Spots Dr
- 4819 Candy Spots Dr
- 4903 Candy Spots Ct
- 4819 Whirlaway Dr
