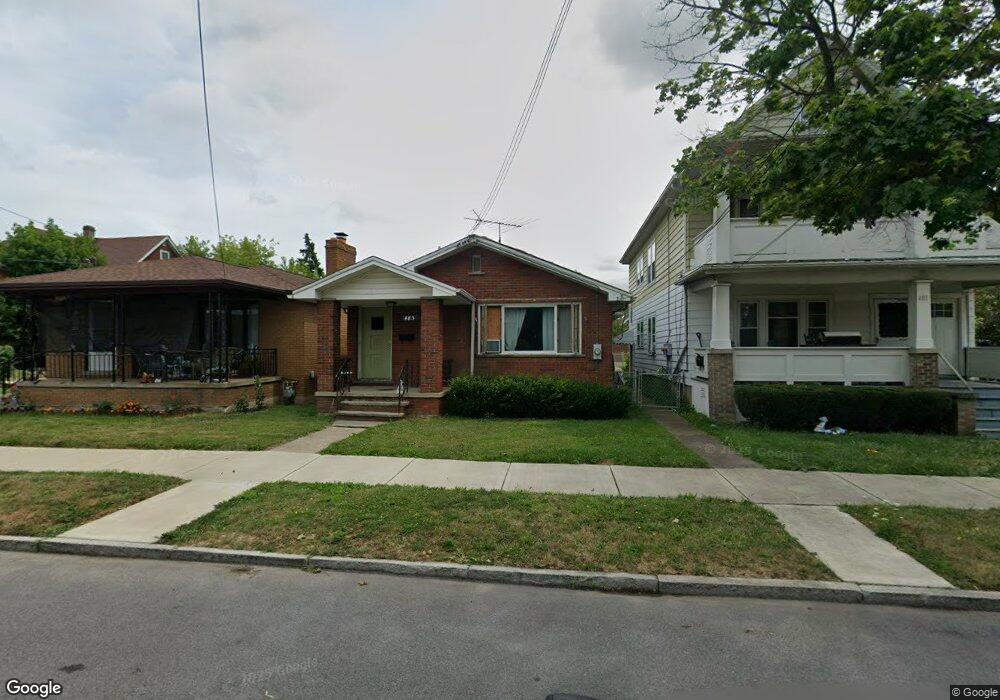
483 21st St Niagara Falls, NY 14303
South End NeighborhoodEstimated Value: $116,000 - $130,700
3
Beds
2
Baths
1,104
Sq Ft
$111/Sq Ft
Est. Value
About This Home
This home is located at 483 21st St, Niagara Falls, NY 14303 and is currently estimated at $122,425, approximately $110 per square foot. 483 21st St is a home located in Niagara County with nearby schools including Niagara Falls High School and St. Joseph Elementary School.
Ownership History
Date
Name
Owned For
Owner Type
Purchase Details
Closed on
Apr 26, 2020
Sold by
Donatelli Joan M and Hendry Sharon M
Bought by
Erla Holdings Llc
Current Estimated Value
Home Financials for this Owner
Home Financials are based on the most recent Mortgage that was taken out on this home.
Original Mortgage
$75,900
Outstanding Balance
$67,509
Interest Rate
3.5%
Mortgage Type
Commercial
Estimated Equity
$54,916
Purchase Details
Closed on
Jul 2, 2013
Sold by
Colucci John C and Colucci Nancy A
Bought by
Equity Trust Co and Fbo 2137528Ira
Purchase Details
Closed on
Aug 16, 2004
Sold by
Anna Muscarella
Bought by
Colucci John
Create a Home Valuation Report for This Property
The Home Valuation Report is an in-depth analysis detailing your home's value as well as a comparison with similar homes in the area
Home Values in the Area
Average Home Value in this Area
Purchase History
| Date | Buyer | Sale Price | Title Company |
|---|---|---|---|
| Erla Holdings Llc | $52,000 | None Available | |
| Equity Trust Co | $40,000 | None Available | |
| Colucci John | -- | Angelo Massaro |
Source: Public Records
Mortgage History
| Date | Status | Borrower | Loan Amount |
|---|---|---|---|
| Open | Erla Holdings Llc | $75,900 |
Source: Public Records
Tax History Compared to Growth
Tax History
| Year | Tax Paid | Tax Assessment Tax Assessment Total Assessment is a certain percentage of the fair market value that is determined by local assessors to be the total taxable value of land and additions on the property. | Land | Improvement |
|---|---|---|---|---|
| 2024 | $3,699 | $54,600 | $2,100 | $52,500 |
| 2023 | $2,183 | $54,600 | $2,100 | $52,500 |
| 2022 | $1,597 | $54,600 | $2,100 | $52,500 |
| 2021 | $1,597 | $54,600 | $2,100 | $52,500 |
| 2020 | $1,060 | $54,600 | $2,100 | $52,500 |
| 2019 | $1,017 | $54,600 | $2,100 | $52,500 |
| 2018 | $1,569 | $54,600 | $2,100 | $52,500 |
| 2017 | $1,017 | $54,600 | $2,100 | $52,500 |
| 2016 | $2,963 | $54,600 | $2,100 | $52,500 |
| 2015 | -- | $54,600 | $2,100 | $52,500 |
| 2014 | -- | $54,600 | $2,100 | $52,500 |
Source: Public Records
Map
Nearby Homes