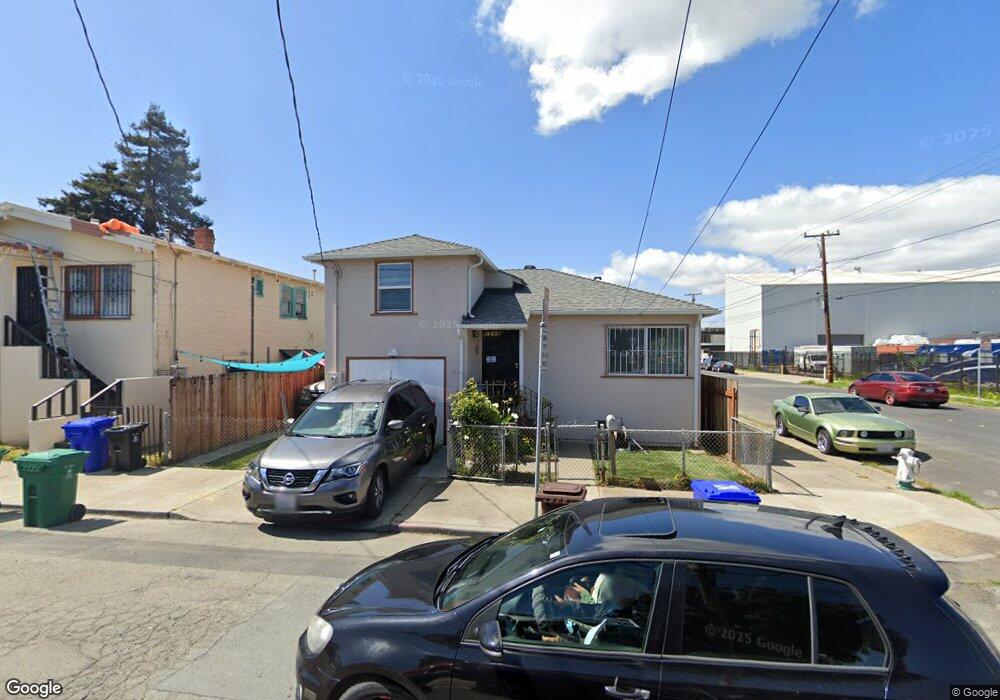
483 2nd St Richmond, CA 94801
Iron Triangle NeighborhoodEstimated Value: $382,000 - $446,000
2
Beds
1
Bath
813
Sq Ft
$523/Sq Ft
Est. Value
About This Home
This home is located at 483 2nd St, Richmond, CA 94801 and is currently estimated at $424,872, approximately $522 per square foot. 483 2nd St is a home located in Contra Costa County with nearby schools including Lincoln Elementary School, Lovonya DeJean Middle School, and John F. Kennedy High School.
Ownership History
Date
Name
Owned For
Owner Type
Purchase Details
Closed on
Oct 26, 2021
Sold by
Romero Brothers Company Inc
Bought by
Romero Alejandro
Current Estimated Value
Home Financials for this Owner
Home Financials are based on the most recent Mortgage that was taken out on this home.
Original Mortgage
$242,500
Outstanding Balance
$222,394
Interest Rate
3.05%
Mortgage Type
New Conventional
Estimated Equity
$202,478
Purchase Details
Closed on
Apr 14, 2021
Sold by
Linan Anthony
Bought by
Anthony Linan 2005 Separate Property Tru and Padilla
Purchase Details
Closed on
Apr 5, 2021
Sold by
Padilla Heidi and The Anthony Linan 2005 Trust
Bought by
Romero Brothers Company Inc
Purchase Details
Closed on
Mar 23, 2021
Sold by
Linan Anthony and Linan Tony
Bought by
Anthony Linan 2005 Separate Property Tru and Padilla
Purchase Details
Closed on
Dec 1, 2005
Sold by
Linan Anthony
Bought by
Linan Anthony
Create a Home Valuation Report for This Property
The Home Valuation Report is an in-depth analysis detailing your home's value as well as a comparison with similar homes in the area
Home Values in the Area
Average Home Value in this Area
Purchase History
| Date | Buyer | Sale Price | Title Company |
|---|---|---|---|
| Romero Alejandro | $250,000 | Lawyers Title Company | |
| Anthony Linan 2005 Separate Property Tru | -- | -- | |
| Romero Brothers Company Inc | $250,000 | Lawyers Title Company | |
| Anthony Linan 2005 Separate Property Tru | -- | -- | |
| Linan Anthony | -- | -- |
Source: Public Records
Mortgage History
| Date | Status | Borrower | Loan Amount |
|---|---|---|---|
| Open | Romero Alejandro | $242,500 |
Source: Public Records
Tax History Compared to Growth
Tax History
| Year | Tax Paid | Tax Assessment Tax Assessment Total Assessment is a certain percentage of the fair market value that is determined by local assessors to be the total taxable value of land and additions on the property. | Land | Improvement |
|---|---|---|---|---|
| 2025 | $7,278 | $407,502 | $257,873 | $149,629 |
| 2024 | $7,036 | $399,513 | $252,817 | $146,696 |
| 2023 | $7,036 | $391,680 | $247,860 | $143,820 |
| 2022 | $6,902 | $384,000 | $243,000 | $141,000 |
| 2021 | $6,748 | $62,428 | $22,428 | $40,000 |
| 2019 | $1,934 | $60,578 | $21,764 | $38,814 |
| 2018 | $1,852 | $59,391 | $21,338 | $38,053 |
| 2017 | $1,784 | $58,227 | $20,920 | $37,307 |
| 2016 | $1,718 | $57,086 | $20,510 | $36,576 |
| 2015 | $1,672 | $56,229 | $20,202 | $36,027 |
| 2014 | $1,665 | $55,129 | $19,807 | $35,322 |
Source: Public Records
Map
Nearby Homes