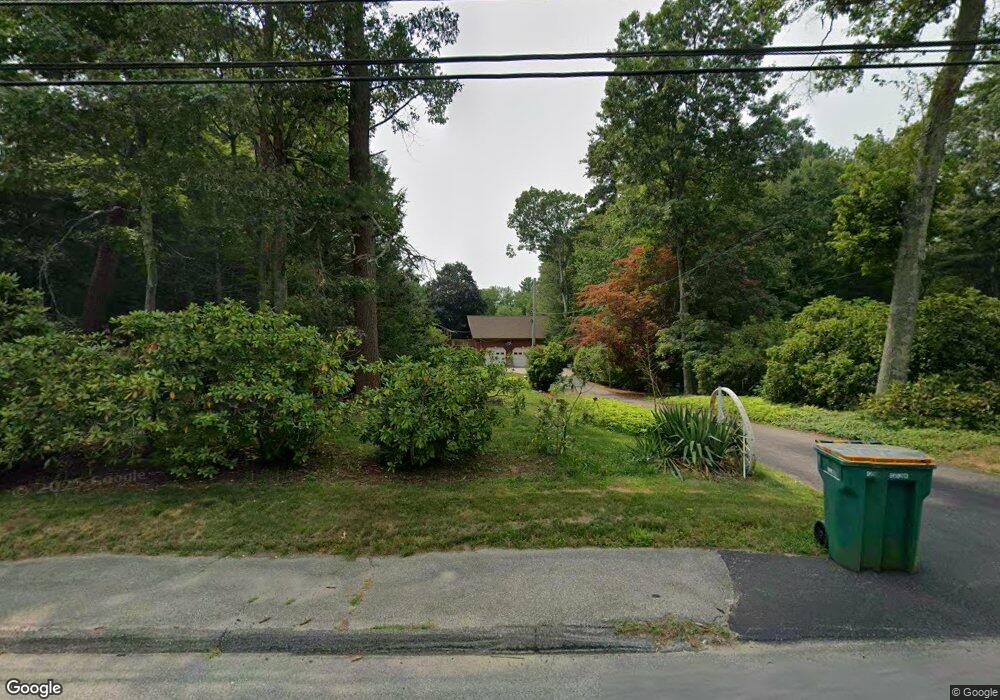
483 Elm St Mansfield, MA 02048
Estimated Value: $667,000 - $756,000
4
Beds
2
Baths
1,514
Sq Ft
$458/Sq Ft
Est. Value
About This Home
This home is located at 483 Elm St, Mansfield, MA 02048 and is currently estimated at $693,009, approximately $457 per square foot. 483 Elm St is a home located in Bristol County with nearby schools including Everett W. Robinson Elementary School, Jordan/Jackson Elementary School, and Harold L. Qualters Middle School.
Ownership History
Date
Name
Owned For
Owner Type
Purchase Details
Closed on
Oct 8, 2020
Sold by
Doreen Cody Stdon Lt
Bought by
Cody-Stdon Doreen and Stdon James E
Current Estimated Value
Purchase Details
Closed on
Jan 11, 2018
Sold by
Stdon Doreen A and Stdon James E
Bought by
Doreen Cody Stdon Lt
Create a Home Valuation Report for This Property
The Home Valuation Report is an in-depth analysis detailing your home's value as well as a comparison with similar homes in the area
Home Values in the Area
Average Home Value in this Area
Purchase History
| Date | Buyer | Sale Price | Title Company |
|---|---|---|---|
| Cody-Stdon Doreen | -- | None Available | |
| Doreen Cody Stdon Lt | -- | -- |
Source: Public Records
Tax History
| Year | Tax Paid | Tax Assessment Tax Assessment Total Assessment is a certain percentage of the fair market value that is determined by local assessors to be the total taxable value of land and additions on the property. | Land | Improvement |
|---|---|---|---|---|
| 2025 | $7,936 | $602,600 | $264,500 | $338,100 |
| 2024 | $7,980 | $591,100 | $264,500 | $326,600 |
| 2023 | $7,811 | $554,400 | $264,500 | $289,900 |
| 2022 | $7,527 | $496,200 | $245,800 | $250,400 |
| 2021 | $7,047 | $458,800 | $214,400 | $244,400 |
| 2020 | $6,666 | $434,000 | $204,600 | $229,400 |
| 2019 | $6,251 | $410,700 | $171,900 | $238,800 |
| 2018 | $5,719 | $386,400 | $164,500 | $221,900 |
| 2017 | $5,739 | $382,100 | $160,200 | $221,900 |
| 2016 | $5,743 | $372,700 | $152,700 | $220,000 |
| 2015 | $5,340 | $344,500 | $152,700 | $191,800 |
Source: Public Records
Map
Nearby Homes
- 2 Oak St Unit 2B
- 44 Surrey Dr
- 451R Gilbert St
- 14 Claire Ave
- 71 Richardson Ave
- 150 Gilbert St
- 143 Oak St Unit 10
- 85 Jewell St
- 250 Mansfield Ave Unit 11
- 343 Godfrey Dr
- 49 Pheasant Hill Rd
- 101 Godfrey Dr Unit 101
- 5 Village Way Unit C
- 345 Richardson Ave
- 10 Anna Way
- 157 Mansfield Ave Unit 27
- 157 Mansfield Ave Unit 14
- 128 Tremont St
- 17 Village Way Unit F
- 24 Maverick Dr
Your Personal Tour Guide
Ask me questions while you tour the home.