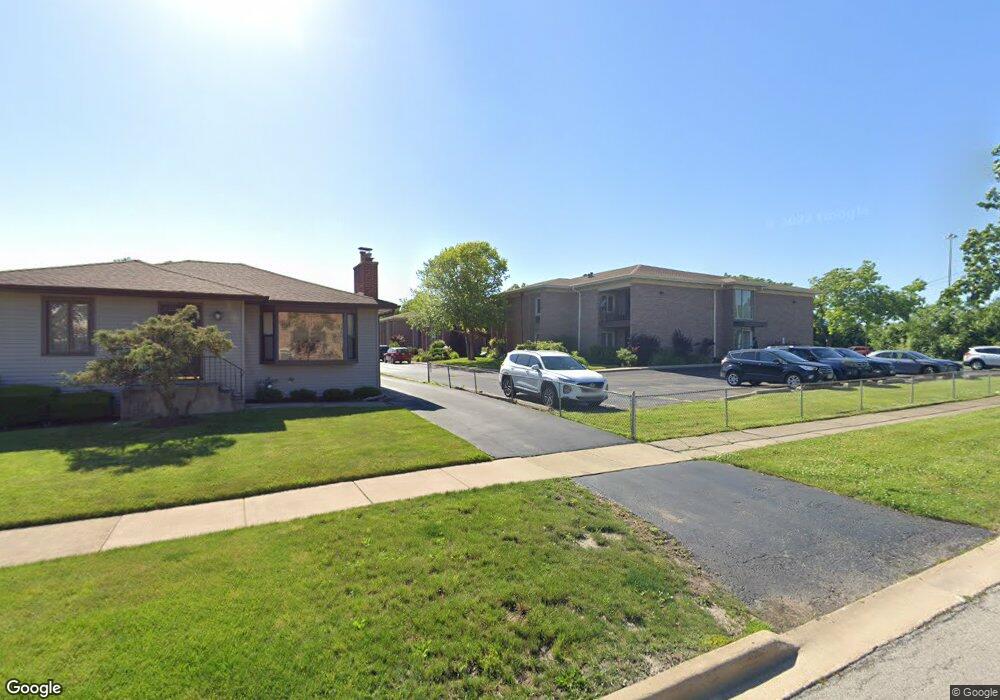
483 N Larch Ave Unit 101W Elmhurst, IL 60126
Estimated Value: $208,066 - $358,000
--
Bed
--
Bath
--
Sq Ft
1.15
Acres
About This Home
This home is located at 483 N Larch Ave Unit 101W, Elmhurst, IL 60126 and is currently estimated at $303,517. 483 N Larch Ave Unit 101W is a home located in DuPage County with nearby schools including Emerson Elementary School, Churchville Middle School, and York Community High School.
Ownership History
Date
Name
Owned For
Owner Type
Purchase Details
Closed on
Aug 24, 2001
Sold by
Castro Mary Jane
Bought by
Haidle Nancy J
Current Estimated Value
Home Financials for this Owner
Home Financials are based on the most recent Mortgage that was taken out on this home.
Original Mortgage
$93,000
Outstanding Balance
$36,042
Interest Rate
7.06%
Mortgage Type
Purchase Money Mortgage
Estimated Equity
$267,475
Purchase Details
Closed on
Aug 30, 1995
Sold by
Old Kent Bank
Bought by
Castro Thomas M and Castro Mary Jane
Home Financials for this Owner
Home Financials are based on the most recent Mortgage that was taken out on this home.
Original Mortgage
$68,400
Interest Rate
7.76%
Mortgage Type
Purchase Money Mortgage
Create a Home Valuation Report for This Property
The Home Valuation Report is an in-depth analysis detailing your home's value as well as a comparison with similar homes in the area
Home Values in the Area
Average Home Value in this Area
Purchase History
| Date | Buyer | Sale Price | Title Company |
|---|---|---|---|
| Haidle Nancy J | $130,000 | -- | |
| Castro Thomas M | $76,000 | -- |
Source: Public Records
Mortgage History
| Date | Status | Borrower | Loan Amount |
|---|---|---|---|
| Open | Haidle Nancy J | $93,000 | |
| Previous Owner | Castro Thomas M | $68,400 |
Source: Public Records
Tax History Compared to Growth
Tax History
| Year | Tax Paid | Tax Assessment Tax Assessment Total Assessment is a certain percentage of the fair market value that is determined by local assessors to be the total taxable value of land and additions on the property. | Land | Improvement |
|---|---|---|---|---|
| 2024 | $3,075 | $58,208 | $7,582 | $50,626 |
| 2023 | $2,809 | $53,510 | $6,970 | $46,540 |
| 2022 | $2,681 | $49,770 | $6,490 | $43,280 |
| 2021 | $2,556 | $47,680 | $6,220 | $41,460 |
| 2020 | $2,395 | $45,670 | $5,960 | $39,710 |
| 2019 | $2,360 | $43,910 | $5,730 | $38,180 |
| 2018 | $2,374 | $43,910 | $5,730 | $38,180 |
| 2017 | $2,317 | $41,970 | $5,480 | $36,490 |
| 2016 | $2,198 | $38,750 | $5,060 | $33,690 |
| 2015 | $2,132 | $35,790 | $4,670 | $31,120 |
| 2014 | $2,319 | $35,790 | $4,670 | $31,120 |
| 2013 | $2,315 | $36,510 | $4,760 | $31,750 |
Source: Public Records
Map
Nearby Homes
- 456 N Elm Ave
- 251 W Armitage Ave
- 634 N Kenilworth Ave
- 183 E Grantley Ave
- 314 N Elm Ave
- 262 N Addison Ave
- 260 N Addison Ave
- 258 N Addison Ave
- 254 N Addison Ave
- 234 E Grantley Ave
- 286 N Indiana St
- 260 E Grantley Ave
- 442 N Oak St
- 195 N Addison Ave Unit PH03
- 193 N Elm Ave
- 468 N Highland Ave
- 412 N Ridgeland Ave
- 240 N Willow Rd
- 322 N Highland Ave
- 284 N Highland Ave
- 483 N Larch Ave Unit 204W
- 483 N Larch Ave Unit 201W
- 483 N Larch Ave Unit 106W
- 483 N Larch Ave Unit 206W
- 483 N Larch Ave Unit 202W
- 483 N Larch Ave Unit 103W
- 483 N Larch Ave Unit 205W
- 483 N Larch Ave Unit 203W
- 483 N Larch Ave Unit 102W
- 483 N Larch Ave Unit 104W
- 483 N Larch Ave Unit 105W
- 484 N Addison Ave Unit 103E
- 484 N Addison Ave Unit 101E
- 484 N Addison Ave Unit 104E
- 484 N Addison Ave Unit 206E
- 484 N Addison Ave Unit 203E
- 484 N Addison Ave Unit 202E
- 484 N Addison Ave Unit 102E
- 484 N Addison Ave Unit 201E
- 484 N Addison Ave Unit 205