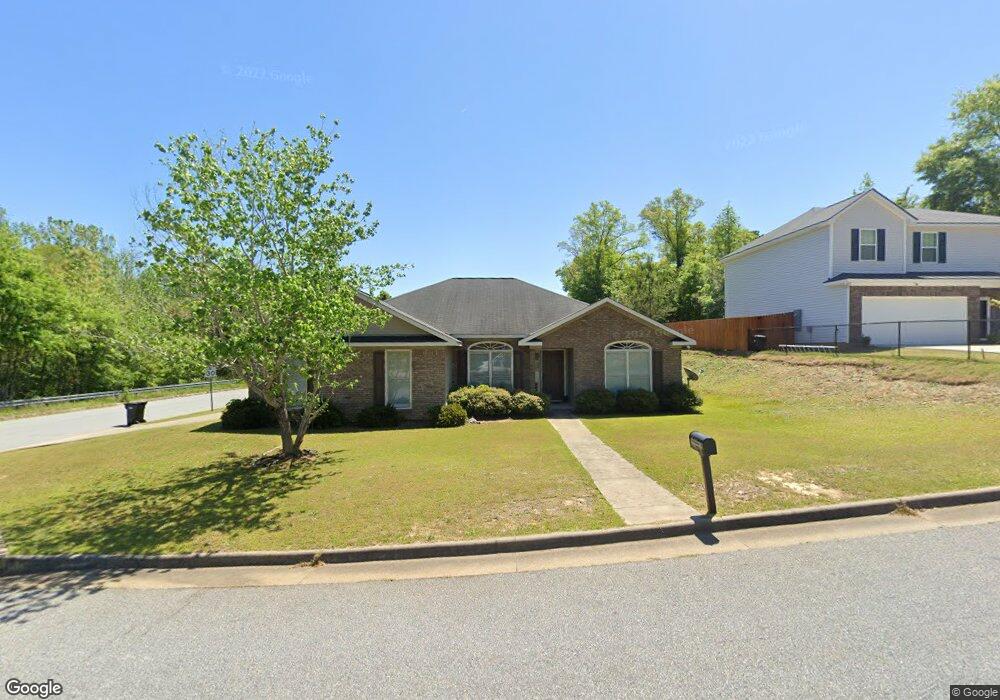
4830 Acme Dr Columbus, GA 31907
Eastern Columbus NeighborhoodEstimated Value: $196,000 - $217,014
3
Beds
3
Baths
1,686
Sq Ft
$122/Sq Ft
Est. Value
About This Home
This home is located at 4830 Acme Dr, Columbus, GA 31907 and is currently estimated at $206,004, approximately $122 per square foot. 4830 Acme Dr is a home located in Muscogee County with nearby schools including Wesley Heights Elementary School, Rothschild Leadership Academy, and Kendrick High School.
Ownership History
Date
Name
Owned For
Owner Type
Purchase Details
Closed on
Jun 15, 2018
Sold by
Threatt Derick
Bought by
Holloway Derek A and Edwards Hollowa Dondra A
Current Estimated Value
Home Financials for this Owner
Home Financials are based on the most recent Mortgage that was taken out on this home.
Original Mortgage
$139,428
Outstanding Balance
$121,252
Interest Rate
4.75%
Mortgage Type
FHA
Estimated Equity
$84,752
Purchase Details
Closed on
Apr 22, 2008
Sold by
Suntrust Bank
Bought by
Pate Development Inc
Home Financials for this Owner
Home Financials are based on the most recent Mortgage that was taken out on this home.
Original Mortgage
$167,219
Interest Rate
6.03%
Mortgage Type
VA
Purchase Details
Closed on
Apr 18, 2008
Sold by
Pate Development Inc
Bought by
Threatt Derick
Home Financials for this Owner
Home Financials are based on the most recent Mortgage that was taken out on this home.
Original Mortgage
$167,219
Interest Rate
6.03%
Mortgage Type
VA
Create a Home Valuation Report for This Property
The Home Valuation Report is an in-depth analysis detailing your home's value as well as a comparison with similar homes in the area
Home Values in the Area
Average Home Value in this Area
Purchase History
| Date | Buyer | Sale Price | Title Company |
|---|---|---|---|
| Holloway Derek A | $142,000 | -- | |
| Pate Development Inc | -- | None Available | |
| Threatt Derick | $163,700 | None Available |
Source: Public Records
Mortgage History
| Date | Status | Borrower | Loan Amount |
|---|---|---|---|
| Open | Holloway Derek A | $139,428 | |
| Previous Owner | Threatt Derick | $167,219 |
Source: Public Records
Tax History Compared to Growth
Tax History
| Year | Tax Paid | Tax Assessment Tax Assessment Total Assessment is a certain percentage of the fair market value that is determined by local assessors to be the total taxable value of land and additions on the property. | Land | Improvement |
|---|---|---|---|---|
| 2025 | $3,164 | $80,824 | $10,852 | $69,972 |
| 2024 | $3,164 | $80,824 | $10,852 | $69,972 |
| 2023 | $3,184 | $80,824 | $10,852 | $69,972 |
| 2022 | $2,429 | $59,484 | $10,852 | $48,632 |
| 2021 | $2,073 | $50,764 | $10,852 | $39,912 |
| 2020 | $2,073 | $50,764 | $10,852 | $39,912 |
| 2019 | $2,080 | $50,764 | $10,852 | $39,912 |
| 2018 | $2,080 | $50,764 | $10,852 | $39,912 |
| 2017 | $2,123 | $50,764 | $10,852 | $39,912 |
| 2016 | $0 | $47,208 | $9,000 | $38,208 |
| 2015 | $2,123 | $51,414 | $9,000 | $42,414 |
| 2014 | $2,354 | $64,746 | $9,000 | $55,746 |
| 2013 | -- | $64,746 | $9,000 | $55,746 |
Source: Public Records
Map
Nearby Homes
- 4642 Wellborn Dr
- 4937 Gardiner Dr
- 2246 Danbury Dr
- 4785 Gardiner Dr
- 1618 Edgechester Ave
- 4979 Gardiner Dr
- 4952 Gardiner Dr
- 2307 Skylake Dr
- 2249 Mahan Dr
- 1354 Floyd Rd
- 4630 Gardiner Dr
- 5759 Forrest Rd
- 1524 Hagan Dr
- 2520 Harwich Cir
- 5035 Gibbs Dr
- 2622 Natchez Dr
- 00 Floyd Ct
- 2505 White Chapel Dr
- 1918 Watkins Dr
- 4418 Gardiner Dr
- 4826 Acme Dr
- 4829 Acme Dr
- 5011 Kingsberry Ln
- 5023 Seneca Dr
- 5019 Kingsberry Ln
- 5019 Seneca Dr
- 4831 Acme Dr
- 5009 Kingsberry Ln
- 5029 Seneca Dr
- 4827 Acme Dr
- 5160 Kingsberry St
- 5021 Kingsberry Ln
- 5001 Kingsberry Ln
- 5033 Seneca Dr
- 4823 Acme Dr
- 5166 Kingsberry St
- 5025 Kingsberry Ln
- 4967 Wilcox Way
- 5172 Kingsberry St
- 4963 Wilcox Way