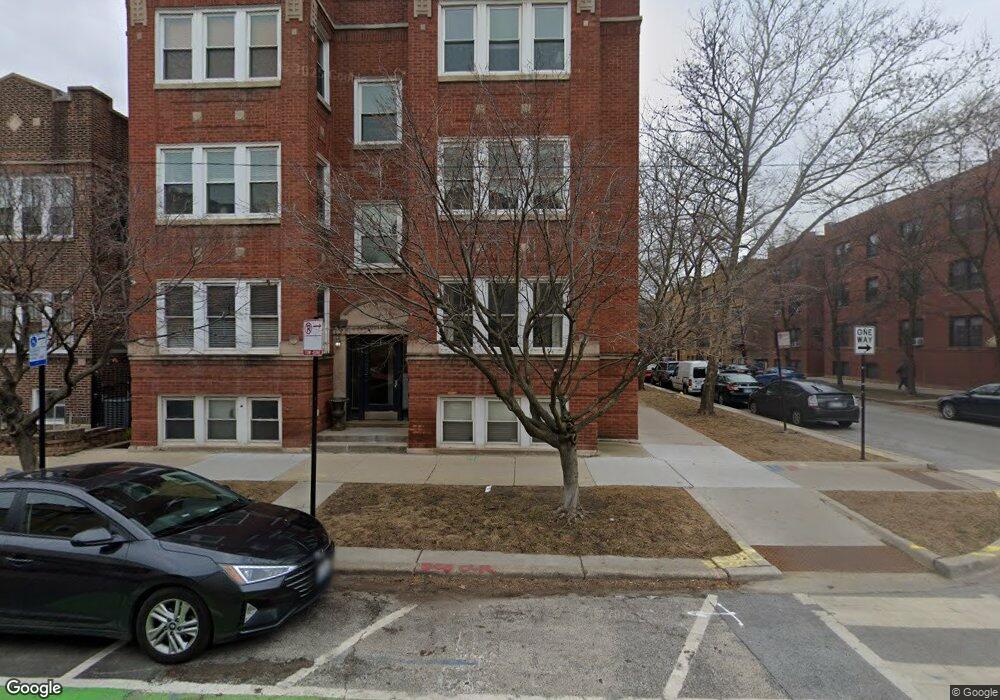
4830 N Rockwell St Unit 48302 Chicago, IL 60625
Lincoln Square NeighborhoodEstimated Value: $327,000 - $432,000
2
Beds
1
Bath
1,200
Sq Ft
$319/Sq Ft
Est. Value
About This Home
This home is located at 4830 N Rockwell St Unit 48302, Chicago, IL 60625 and is currently estimated at $383,078, approximately $319 per square foot. 4830 N Rockwell St Unit 48302 is a home located in Cook County with nearby schools including Budlong Elementary School, Amundsen High School, and St. Matthias School.
Ownership History
Date
Name
Owned For
Owner Type
Purchase Details
Closed on
Jul 24, 2015
Sold by
Winke Kenneth and Spera Tracy
Bought by
Bever Max Russell
Current Estimated Value
Home Financials for this Owner
Home Financials are based on the most recent Mortgage that was taken out on this home.
Original Mortgage
$235,600
Outstanding Balance
$186,918
Interest Rate
4.37%
Mortgage Type
New Conventional
Estimated Equity
$196,160
Purchase Details
Closed on
Feb 1, 2008
Sold by
Betke Jason J and Pryor Katherine A
Bought by
Winke Kenneth and Spera Tracy
Home Financials for this Owner
Home Financials are based on the most recent Mortgage that was taken out on this home.
Original Mortgage
$201,000
Interest Rate
6.11%
Mortgage Type
Purchase Money Mortgage
Purchase Details
Closed on
Jul 9, 2004
Sold by
Rockwell North Ltd
Bought by
Betke Jason J and Pryor Katherine A
Home Financials for this Owner
Home Financials are based on the most recent Mortgage that was taken out on this home.
Original Mortgage
$208,000
Interest Rate
5.5%
Mortgage Type
Unknown
Create a Home Valuation Report for This Property
The Home Valuation Report is an in-depth analysis detailing your home's value as well as a comparison with similar homes in the area
Home Values in the Area
Average Home Value in this Area
Purchase History
| Date | Buyer | Sale Price | Title Company |
|---|---|---|---|
| Bever Max Russell | $248,000 | Ctt | |
| Winke Kenneth | $270,000 | Multiple | |
| Betke Jason J | $260,500 | Cti |
Source: Public Records
Mortgage History
| Date | Status | Borrower | Loan Amount |
|---|---|---|---|
| Open | Bever Max Russell | $235,600 | |
| Previous Owner | Winke Kenneth | $201,000 | |
| Previous Owner | Betke Jason J | $208,000 | |
| Closed | Betke Jason J | $39,000 |
Source: Public Records
Tax History Compared to Growth
Tax History
| Year | Tax Paid | Tax Assessment Tax Assessment Total Assessment is a certain percentage of the fair market value that is determined by local assessors to be the total taxable value of land and additions on the property. | Land | Improvement |
|---|---|---|---|---|
| 2024 | $4,685 | $26,735 | $1,512 | $25,223 |
| 2023 | $4,546 | $25,520 | $1,022 | $24,498 |
| 2022 | $4,546 | $25,520 | $1,022 | $24,498 |
| 2021 | $4,462 | $25,520 | $1,022 | $24,498 |
| 2020 | $3,904 | $20,627 | $1,022 | $19,605 |
| 2019 | $3,883 | $22,756 | $1,022 | $21,734 |
| 2018 | $3,816 | $22,756 | $1,022 | $21,734 |
| 2017 | $4,418 | $23,897 | $894 | $23,003 |
| 2016 | $4,286 | $23,897 | $894 | $23,003 |
| 2015 | $3,898 | $23,897 | $894 | $23,003 |
| 2014 | $3,893 | $23,551 | $830 | $22,721 |
| 2013 | $3,805 | $23,551 | $830 | $22,721 |
Source: Public Records
Map
Nearby Homes
- 4850 N Rockwell St
- 2527 W Argyle St
- 4755 N Washtenaw Ave Unit P-27
- 4755 N Washtenaw Ave Unit P-25
- 4755 N Washtenaw Ave Unit P-11
- 2720 W Gunnison St
- 2709 W Lawrence Ave Unit 3
- 2540 W Leland Ave Unit 2
- 4751 N Artesian Ave Unit 205
- 4751 N Artesian Ave Unit 409
- 2522 W Winnemac Ave
- 2524 W Winnemac Ave
- 2617 W Leland Ave Unit 1
- 4950 N Western Ave Unit 5H
- 4701 N Campbell Ave Unit 2
- 2607 W Carmen Ave
- 5061 N Lincoln Ave Unit 201
- 2455 W Leland Ave Unit 1
- 2505 W Carmen Ave Unit 303
- 2754 W Giddings St
- 4830 N Rockwell St Unit 4830G
- 4830 N Rockwell St Unit 48303
- 4830 N Rockwell St Unit 48301
- 4830 N Rockwell St Unit G
- 4830 N Rockwell St Unit 3
- 4830 N Rockwell St Unit 2
- 4830 N Rockwell St Unit 1
- 2609 W Gunnison St Unit 26092
- 2609 W Gunnison St Unit 26093
- 2607 W Gunnison St Unit 26073
- 2609 W Gunnison St Unit 26091
- 2607 W Gunnison St Unit 26072
- 2607 W Gunnison St Unit 26071
- 2607 W Gunnison St Unit 2607G
- 2607 W Gunnison St Unit 3
- 2609 W Gunnison St Unit 3
- 2607 W Gunnison St Unit 2
- 2609 W Gunnison St Unit 2
- 2607 W Gunnison St Unit 1
- 2609 W Gunnison St Unit 1