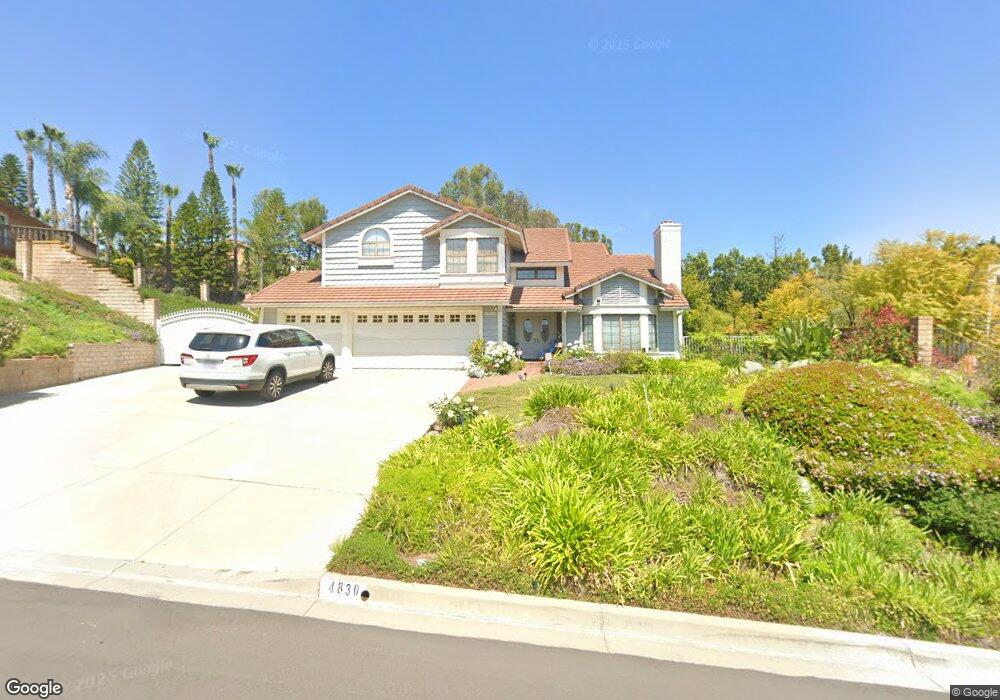
4830 Via Del Corral Yorba Linda, CA 92887
Estimated Value: $1,842,164 - $2,179,000
4
Beds
3
Baths
3,069
Sq Ft
$652/Sq Ft
Est. Value
About This Home
This home is located at 4830 Via Del Corral, Yorba Linda, CA 92887 and is currently estimated at $2,001,291, approximately $652 per square foot. 4830 Via Del Corral is a home located in Orange County with nearby schools including Travis Ranch Middle School, Yorba Linda High School, and Ivycrest Montessori Private School - Yorba Linda.
Ownership History
Date
Name
Owned For
Owner Type
Purchase Details
Closed on
Nov 10, 2009
Sold by
Weiner Julianne C
Bought by
Weiner Julianne C
Current Estimated Value
Home Financials for this Owner
Home Financials are based on the most recent Mortgage that was taken out on this home.
Original Mortgage
$316,000
Outstanding Balance
$205,490
Interest Rate
4.92%
Mortgage Type
New Conventional
Estimated Equity
$1,795,801
Purchase Details
Closed on
Jun 15, 2009
Sold by
Weiner Keith M
Bought by
Weiner Julianne C
Purchase Details
Closed on
May 16, 1994
Sold by
Dooley Janice M
Bought by
Weiner Keith M and Weiner Julianne C
Home Financials for this Owner
Home Financials are based on the most recent Mortgage that was taken out on this home.
Original Mortgage
$380,000
Interest Rate
8.6%
Create a Home Valuation Report for This Property
The Home Valuation Report is an in-depth analysis detailing your home's value as well as a comparison with similar homes in the area
Home Values in the Area
Average Home Value in this Area
Purchase History
| Date | Buyer | Sale Price | Title Company |
|---|---|---|---|
| Weiner Julianne C | -- | First American Title | |
| Weiner Julianne C | -- | None Available | |
| Weiner Keith M | $475,000 | Orange Coast Title Company |
Source: Public Records
Mortgage History
| Date | Status | Borrower | Loan Amount |
|---|---|---|---|
| Open | Weiner Julianne C | $316,000 | |
| Previous Owner | Weiner Keith M | $380,000 | |
| Closed | Weiner Keith M | $47,500 |
Source: Public Records
Tax History Compared to Growth
Tax History
| Year | Tax Paid | Tax Assessment Tax Assessment Total Assessment is a certain percentage of the fair market value that is determined by local assessors to be the total taxable value of land and additions on the property. | Land | Improvement |
|---|---|---|---|---|
| 2025 | $9,360 | $797,853 | $414,048 | $383,805 |
| 2024 | $9,360 | $782,209 | $405,929 | $376,280 |
| 2023 | $9,189 | $766,872 | $397,970 | $368,902 |
| 2022 | $9,079 | $751,836 | $390,167 | $361,669 |
| 2021 | $8,912 | $737,095 | $382,517 | $354,578 |
| 2020 | $8,812 | $729,537 | $378,594 | $350,943 |
| 2019 | $8,504 | $715,233 | $371,171 | $344,062 |
| 2018 | $8,305 | $701,209 | $363,893 | $337,316 |
| 2017 | $8,248 | $687,460 | $356,758 | $330,702 |
| 2016 | $8,086 | $673,981 | $349,763 | $324,218 |
| 2015 | $7,990 | $663,858 | $344,510 | $319,348 |
| 2014 | $7,759 | $650,854 | $337,761 | $313,093 |
Source: Public Records
Map
Nearby Homes
- 4811 Rideline Rd
- 21417 Zaca Ct
- 21620 Brisbane Way
- 21451 Cloud Ridge
- 21630 Dunrobin Way
- 5000 Stonehaven Dr
- 20681 Via Amarilla
- 20709 Calle Pera
- 20660 Calle Feliz
- 21925 Heatheridge Dr
- 5317 Via Ramon Rd
- 20640 Smoketree Ave
- 21290 Clear Haven Dr
- 21590 Via Pepita
- 3971 Hollow Ridge Ct
- 4152 Beech Ave
- 5685 Avenida Florencia
- 5795 Via Perla
- 5851 Via Santana
- 5505 Calle Vista Linda
- 4820 Via Del Corral
- 4840 Via Del Corral
- 4810 Via Del Corral
- 4785 Via de la Roca
- 4795 Via de la Roca
- 4865 Via Del Corral
- 4800 Via Del Corral
- 4855 Via Del Corral
- 4875 Via Del Corral
- 4790 Via de la Roca
- 4825 Via Del Corral
- 4835 Via Del Corral
- 4815 Via Del Corral
- 4845 Via Del Corral
- 4800 Via de la Roca
- 21295 Via de la Reata
- 4805 Via Del Corral
- 21305 Via de la Reata
- 4800 Via Del Agua
- 4915 Via Del Cerro