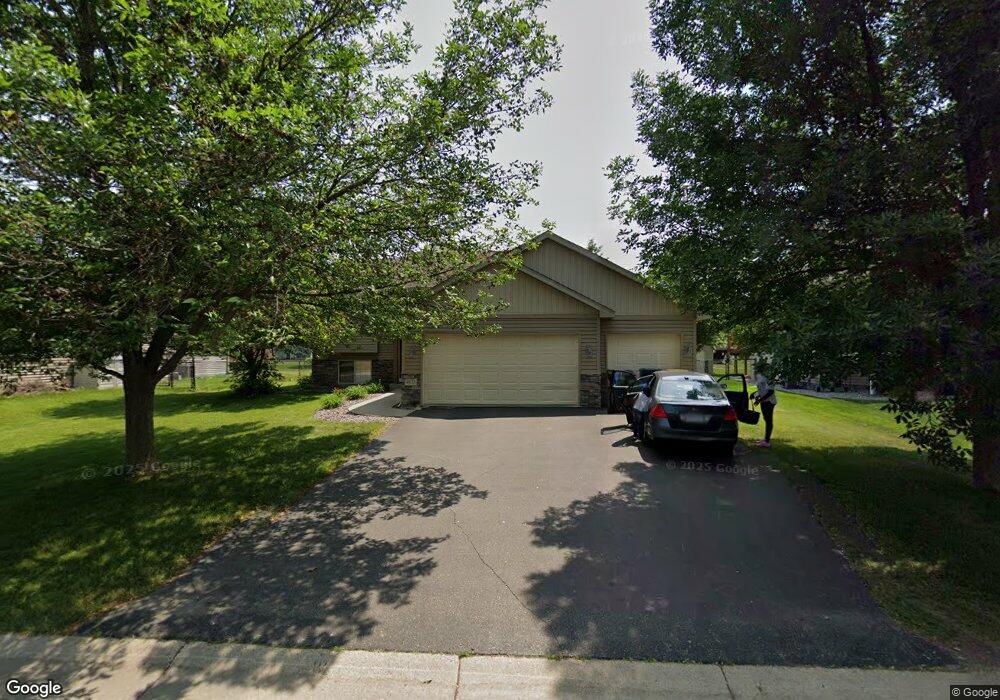
4832 189th St W Farmington, MN 55024
Estimated Value: $407,523 - $421,000
4
Beds
2
Baths
2,040
Sq Ft
$202/Sq Ft
Est. Value
About This Home
This home is located at 4832 189th St W, Farmington, MN 55024 and is currently estimated at $412,381, approximately $202 per square foot. 4832 189th St W is a home located in Dakota County with nearby schools including Akin Road Elementary School, Levi P. Dodge Middle School, and Farmington High School.
Ownership History
Date
Name
Owned For
Owner Type
Purchase Details
Closed on
Jun 19, 2020
Sold by
Hird Chad Michael and Hird Nicole C
Bought by
Okumu Omot L and Ojulu Awili
Current Estimated Value
Home Financials for this Owner
Home Financials are based on the most recent Mortgage that was taken out on this home.
Original Mortgage
$322,040
Outstanding Balance
$284,926
Interest Rate
3.1%
Mortgage Type
New Conventional
Estimated Equity
$127,455
Purchase Details
Closed on
Oct 27, 2017
Sold by
Benz James A and Benz Rhea M
Bought by
Hird Chad Michael and Hird Nicole C
Home Financials for this Owner
Home Financials are based on the most recent Mortgage that was taken out on this home.
Original Mortgage
$283,765
Interest Rate
3.75%
Mortgage Type
FHA
Purchase Details
Closed on
Feb 6, 2003
Sold by
Topaz Llc
Bought by
C & M Home Builders Inc
Purchase Details
Closed on
Dec 6, 2002
Sold by
Progress Land Company Inc
Bought by
Topaz Llc
Create a Home Valuation Report for This Property
The Home Valuation Report is an in-depth analysis detailing your home's value as well as a comparison with similar homes in the area
Home Values in the Area
Average Home Value in this Area
Purchase History
| Date | Buyer | Sale Price | Title Company |
|---|---|---|---|
| Okumu Omot L | $332,000 | Global Closing & Title Svcs | |
| Hird Chad Michael | $289,000 | Gibraltar Title | |
| C & M Home Builders Inc | $58,900 | -- | |
| Topaz Llc | $1,635,000 | -- |
Source: Public Records
Mortgage History
| Date | Status | Borrower | Loan Amount |
|---|---|---|---|
| Open | Okumu Omot L | $322,040 | |
| Previous Owner | Hird Chad Michael | $283,765 |
Source: Public Records
Tax History Compared to Growth
Tax History
| Year | Tax Paid | Tax Assessment Tax Assessment Total Assessment is a certain percentage of the fair market value that is determined by local assessors to be the total taxable value of land and additions on the property. | Land | Improvement |
|---|---|---|---|---|
| 2024 | $4,534 | $351,900 | $99,600 | $252,300 |
| 2023 | $4,534 | $375,300 | $99,800 | $275,500 |
| 2022 | $4,254 | $357,300 | $99,500 | $257,800 |
| 2021 | $4,080 | $306,500 | $86,600 | $219,900 |
| 2020 | $4,152 | $293,000 | $82,400 | $210,600 |
| 2019 | $4,021 | $286,800 | $78,500 | $208,300 |
| 2018 | $3,723 | $273,700 | $72,900 | $200,800 |
| 2017 | $3,628 | $248,400 | $69,400 | $179,000 |
| 2016 | $3,615 | $236,500 | $66,100 | $170,400 |
| 2015 | $3,242 | $213,024 | $59,194 | $153,830 |
| 2014 | -- | $201,579 | $54,742 | $146,837 |
| 2013 | -- | $179,670 | $48,303 | $131,367 |
Source: Public Records
Map
Nearby Homes
- 18932 Dunbury Ave
- 4750 190th St W
- 18973 Embry Ave
- 5151 193rd St W
- 19320 Ellington Trail
- 19229 Everfield Ave
- 19055 Enchanted Way
- 5412 188th St W
- 5413 186th St W
- 18840 Enhance Ct
- 4569 196th St W
- 19110 Euclid Path
- 18325 Embers Ave
- 18568 Euclid Path
- 4578 198th St W
- 19871 Dover Dr
- 18231 Elkwood Ave
- 19697 Deerbrooke Path
- 18220 Empire Trail
- 19171 Cottage Rd
- 4826 189th St W
- 4838 189th St W
- 4831 190th St W
- 4837 190th St W
- 4820 189th St W
- 4844 189th St W
- 4825 190th St W
- 4843 190th St W
- 4835 4835 189th-Street-w
- 4835 189th St W
- 4829 4829 189th-Street-w
- 4829 189th St W
- 4819 190th St W
- 4814 189th St W
- 4841 189th St W
- 4850 4850 189th-Street-w
- 4850 189th St W
- 4823 189th St W
- 4849 190th St W
- 4847 189th St W