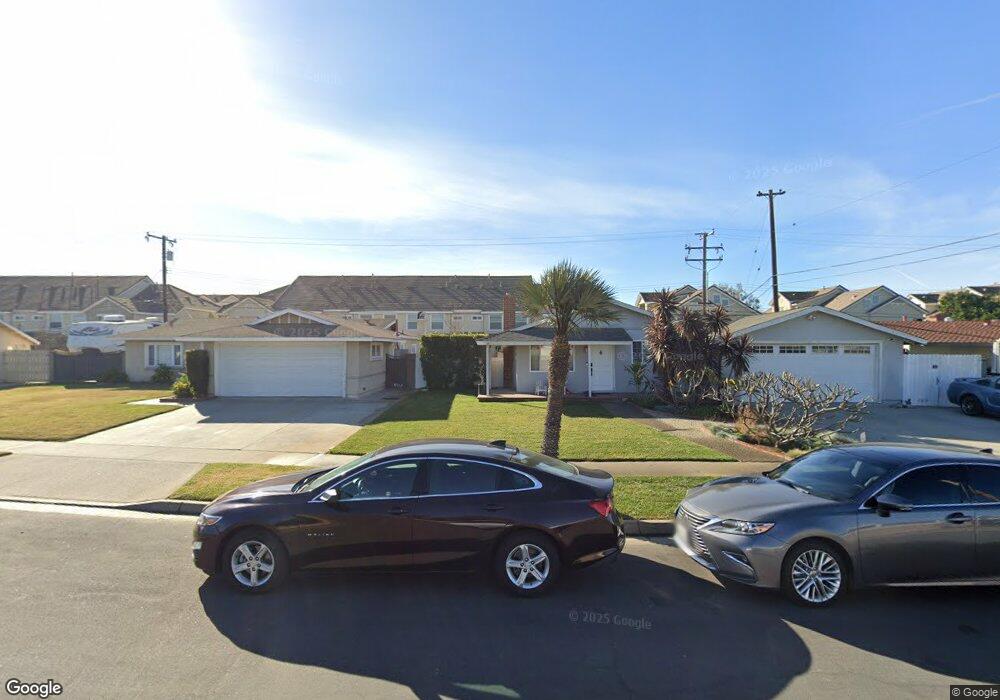
4832 Aquamarine Way Unit 25 Cypress, CA 90630
Estimated Value: $781,000 - $890,000
2
Beds
3
Baths
1,595
Sq Ft
$514/Sq Ft
Est. Value
About This Home
This home is located at 4832 Aquamarine Way Unit 25, Cypress, CA 90630 and is currently estimated at $819,114, approximately $513 per square foot. 4832 Aquamarine Way Unit 25 is a home located in Orange County with nearby schools including Clara J. King Elementary School, Walker Junior High School, and John F. Kennedy High School.
Ownership History
Date
Name
Owned For
Owner Type
Purchase Details
Closed on
Nov 10, 2020
Sold by
Chrun Rene
Bought by
Chrun Rene
Current Estimated Value
Home Financials for this Owner
Home Financials are based on the most recent Mortgage that was taken out on this home.
Original Mortgage
$398,000
Outstanding Balance
$354,163
Interest Rate
2.8%
Mortgage Type
New Conventional
Estimated Equity
$464,951
Purchase Details
Closed on
Nov 15, 2016
Sold by
Sun Shih Chuan and Sun Shih Yu
Bought by
Chrun Rene
Purchase Details
Closed on
Dec 21, 2006
Sold by
Nevis Cypress Llc
Bought by
Sun Shih Chuan and Chrun Rene
Home Financials for this Owner
Home Financials are based on the most recent Mortgage that was taken out on this home.
Original Mortgage
$373,600
Interest Rate
6.12%
Mortgage Type
Purchase Money Mortgage
Create a Home Valuation Report for This Property
The Home Valuation Report is an in-depth analysis detailing your home's value as well as a comparison with similar homes in the area
Home Values in the Area
Average Home Value in this Area
Purchase History
| Date | Buyer | Sale Price | Title Company |
|---|---|---|---|
| Chrun Rene | -- | Old Republic Title Company | |
| Chrun Rene | -- | None Available | |
| Sun Shih Chuan | $458,000 | Fidelity National Title Co |
Source: Public Records
Mortgage History
| Date | Status | Borrower | Loan Amount |
|---|---|---|---|
| Open | Chrun Rene | $398,000 | |
| Previous Owner | Sun Shih Chuan | $373,600 |
Source: Public Records
Tax History Compared to Growth
Tax History
| Year | Tax Paid | Tax Assessment Tax Assessment Total Assessment is a certain percentage of the fair market value that is determined by local assessors to be the total taxable value of land and additions on the property. | Land | Improvement |
|---|---|---|---|---|
| 2025 | $6,401 | $572,058 | $312,105 | $259,953 |
| 2024 | $6,401 | $560,842 | $305,986 | $254,856 |
| 2023 | $6,254 | $549,846 | $299,987 | $249,859 |
| 2022 | $6,181 | $539,065 | $294,105 | $244,960 |
| 2021 | $6,099 | $528,496 | $288,339 | $240,157 |
| 2020 | $6,075 | $523,077 | $285,382 | $237,695 |
| 2019 | $5,902 | $512,821 | $279,786 | $233,035 |
| 2018 | $5,395 | $464,053 | $249,138 | $214,915 |
| 2017 | $5,308 | $464,053 | $249,138 | $214,915 |
| 2016 | $5,027 | $433,491 | $190,031 | $243,460 |
| 2015 | $5,062 | $433,491 | $190,031 | $243,460 |
| 2014 | $4,793 | $425,000 | $186,309 | $238,691 |
Source: Public Records
Map
Nearby Homes
- 4617 Alekona Ct
- 9051 Cobblestone Ln Unit 40
- 4823 Fieldbrook Ln Unit 24
- 8742 La Salle St
- 9122 Windsor Cir
- 8606 Belmont St
- 4891 Grace Ave
- 5000 Clementine Ln
- 5275 Vista Real
- 6007 Clementine Ln Unit 21
- Plan A1 at Citrus Square - Cerise
- Plan A2 at Citrus Square - Cerise
- 9001 Cerise Ln Unit 109
- 9001 Cerise Ln Unit 113
- 4790 Montefino Dr
- 9080 Bloomfield Ave Unit 31
- 9080 Bloomfield Ave Unit 237
- 9080 Bloomfield Ave Unit 223
- 9080 Bloomfield Ave Unit 79
- 9080 Bloomfield Ave Unit 126
- 4819 Aquamarine Way Unit 37
- 4844 Aquamarine Way
- 4824 Aquamarine Way
- 4836 Aquamarine Way
- 4828 Aquamarine Way
- 4845 Sapphire Way
- 4841 Sapphire Way
- 4837 Sapphire Way Unit 20
- 4833 Sapphire Way
- 4829 Sapphire Way
- 4825 Sapphire Way
- 4821 Sapphire Way Unit 16
- 4830 Sapphire Way
- 4826 Sapphire Way Unit 12
- 4822 Sapphire Way
- 4818 Sapphire Way
- 4835 Aquamarine Way
- 4831 Aquamarine Way
- 4827 Aquamarine Way
- 4823 Aquamarine Way Unit 38