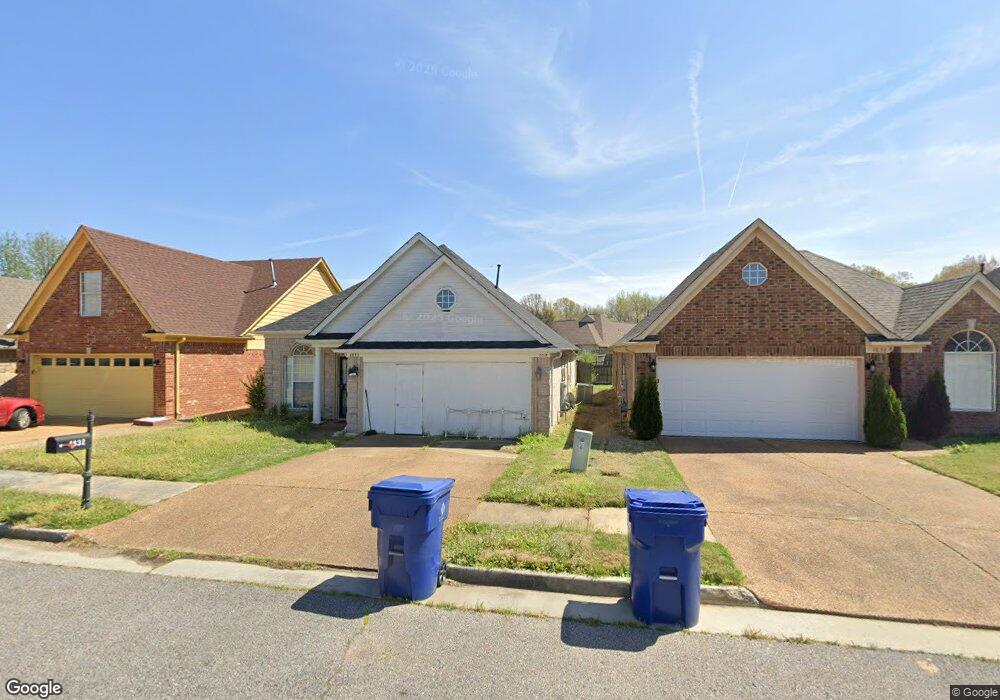
4832 Pine Forrest Dr Memphis, TN 38125
Southern Shelby County NeighborhoodEstimated Value: $221,000 - $255,000
3
Beds
3
Baths
2,122
Sq Ft
$113/Sq Ft
Est. Value
About This Home
This home is located at 4832 Pine Forrest Dr, Memphis, TN 38125 and is currently estimated at $239,602, approximately $112 per square foot. 4832 Pine Forrest Dr is a home located in Shelby County with nearby schools including Southwind Elementary School, Highland Oaks Middle School, and Southwind High School.
Ownership History
Date
Name
Owned For
Owner Type
Purchase Details
Closed on
Sep 24, 2012
Sold by
Pham Ashley
Bought by
Le Long Huang
Current Estimated Value
Purchase Details
Closed on
Aug 27, 2009
Sold by
Wells Fargo Bank National Association
Bought by
Le Long H and Pham Ashley T
Purchase Details
Closed on
May 29, 2009
Sold by
Cole Sheila
Bought by
Wells Fargo Bank National Association
Purchase Details
Closed on
Sep 29, 2005
Sold by
Bowden Building Corp
Bought by
Cole Sheila
Home Financials for this Owner
Home Financials are based on the most recent Mortgage that was taken out on this home.
Original Mortgage
$104,892
Interest Rate
7.79%
Mortgage Type
Fannie Mae Freddie Mac
Create a Home Valuation Report for This Property
The Home Valuation Report is an in-depth analysis detailing your home's value as well as a comparison with similar homes in the area
Home Values in the Area
Average Home Value in this Area
Purchase History
| Date | Buyer | Sale Price | Title Company |
|---|---|---|---|
| Le Long Huang | -- | None Available | |
| Le Long H | $82,000 | Title2land Llc | |
| Wells Fargo Bank National Association | $64,916 | None Available | |
| Cole Sheila | $131,115 | Southern Trust Title Company |
Source: Public Records
Mortgage History
| Date | Status | Borrower | Loan Amount |
|---|---|---|---|
| Previous Owner | Cole Sheila | $104,892 | |
| Closed | Cole Sheila | $26,223 |
Source: Public Records
Tax History
| Year | Tax Paid | Tax Assessment Tax Assessment Total Assessment is a certain percentage of the fair market value that is determined by local assessors to be the total taxable value of land and additions on the property. | Land | Improvement |
|---|---|---|---|---|
| 2025 | $1,568 | $64,975 | $11,500 | $53,475 |
| 2024 | $1,568 | $46,250 | $8,500 | $37,750 |
| 2023 | $1,568 | $46,250 | $8,500 | $37,750 |
| 2022 | $1,568 | $46,250 | $8,500 | $37,750 |
| 2021 | $1,596 | $46,250 | $8,500 | $37,750 |
| 2020 | $1,389 | $34,300 | $8,500 | $25,800 |
| 2019 | $1,389 | $34,300 | $8,500 | $25,800 |
| 2018 | $1,389 | $34,300 | $8,500 | $25,800 |
| 2017 | $1,410 | $34,300 | $8,500 | $25,800 |
| 2016 | $1,306 | $29,875 | $0 | $0 |
| 2014 | $1,306 | $29,875 | $0 | $0 |
Source: Public Records
Map
Nearby Homes
- 7848 Pinefrost Ln
- 4883 Saddlehorn Cove
- 4908 Top Notch Loop
- 7763 Shadowcrest Rd
- 7608 Comstock Cove
- 7703 Driscoll St
- 7709 Canyon Ridge Cove
- 5167 Silver Peak Ln
- 7743 Freehold Dr
- 4502 Sweet Whisper Cove
- 5094 Denton Cove N
- 7518 Harvest Park Cove
- 4580 Wood Fox Cove
- 4419 Berkley Woods Dr
- 4655 Meadow Cliff Dr
- 7407 Heather Knoll Cove
- 8275 Cypress Bend Cove
- 4333 Rainey Woods Cove
- 4994 Harvest Knoll Ln
- 7661 Brookbriar Cove
- 4832 Pine Forest Dr
- 4828 Pine Forest
- 4836 Pine Forrest Dr
- 4828 Pine Forrest Dr
- 4836 Pine Forest Dr
- 4836 Pine Forest
- 4840 Pine Forrest Dr
- 4824 Pine Forrest Dr
- 4840 Pinefrost Cove
- 4840 Pine Forest
- 4820 Pine Forest
- 4820 Pine Forrest Dr
- 7922 Pinefrost Ln
- 7870 Fallstone Rd
- 4844 Pine Forrest Dr
- 7873 Windy Willow Rd
- 4809 Half Moon Cove
- 4815 Half Moon Cove
- 7926 Pinefrost Ln
- 4816 Pine Forrest Dr
Your Personal Tour Guide
Ask me questions while you tour the home.