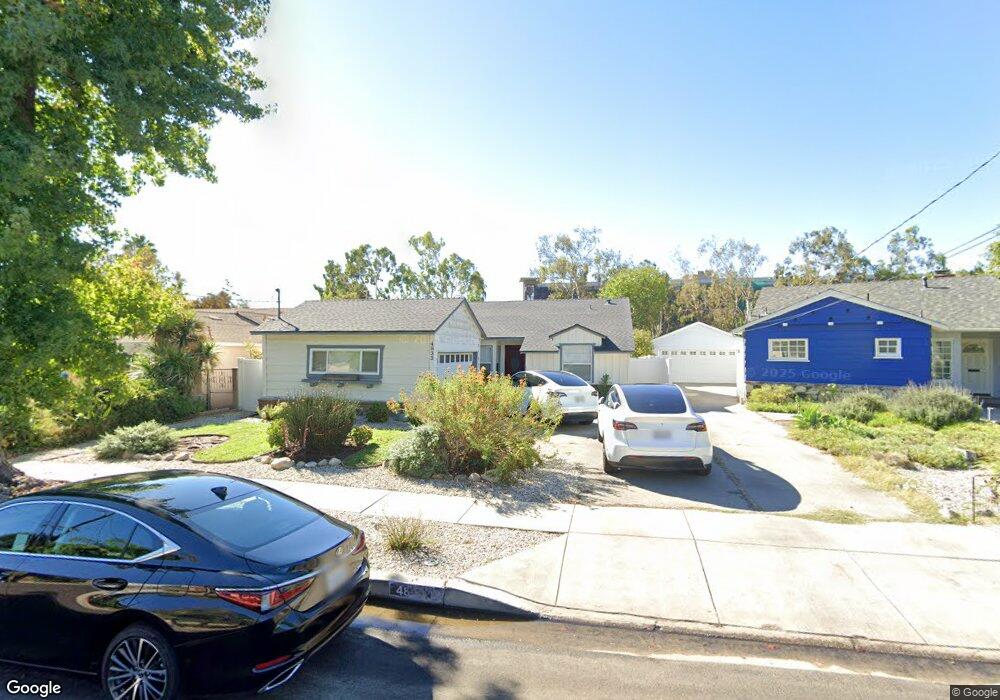
4833 Beeman Ave Valley Village, CA 91607
Estimated Value: $1,231,995 - $1,448,000
3
Beds
2
Baths
1,413
Sq Ft
$973/Sq Ft
Est. Value
About This Home
This home is located at 4833 Beeman Ave, Valley Village, CA 91607 and is currently estimated at $1,374,999, approximately $973 per square foot. 4833 Beeman Ave is a home located in Los Angeles County with nearby schools including Ulysses S. Grant Senior High School, Riverside Drive Charter Elementary School, and Louis D. Armstrong Middle School.
Ownership History
Date
Name
Owned For
Owner Type
Purchase Details
Closed on
Dec 16, 2024
Sold by
Glaser Elizabeth
Bought by
Elizabeth S Glaser Living Trust and Glaser
Current Estimated Value
Purchase Details
Closed on
Apr 30, 2014
Sold by
Glaser Jeffrey A and Glaser Steven H
Bought by
Glaser Elizabeth
Purchase Details
Closed on
Oct 11, 2012
Sold by
Glaser Jack and Glaser Dora W
Bought by
Glaser Jeffrey A and Glaser Steven H
Purchase Details
Closed on
Sep 28, 2010
Sold by
Kislan Timothy A C and Kislan Melanie C
Bought by
Glaser Jack and Glaser Dora
Purchase Details
Closed on
Apr 29, 1994
Sold by
Cahill Christopher Mark and Cahill Melanie Anne
Bought by
Kislan Timothy A C and Cahill Melanie Ann
Home Financials for this Owner
Home Financials are based on the most recent Mortgage that was taken out on this home.
Original Mortgage
$156,000
Interest Rate
3.75%
Create a Home Valuation Report for This Property
The Home Valuation Report is an in-depth analysis detailing your home's value as well as a comparison with similar homes in the area
Home Values in the Area
Average Home Value in this Area
Purchase History
| Date | Buyer | Sale Price | Title Company |
|---|---|---|---|
| Elizabeth S Glaser Living Trust | -- | None Listed On Document | |
| Glaser Elizabeth | -- | None Available | |
| Glaser Jeffrey A | -- | None Available | |
| Glaser Jack | -- | None Available | |
| Glaser Jack | $527,500 | Pacific Coast Title | |
| Kislan Timothy A C | $70,000 | Investors Title Company |
Source: Public Records
Mortgage History
| Date | Status | Borrower | Loan Amount |
|---|---|---|---|
| Previous Owner | Kislan Timothy A C | $156,000 |
Source: Public Records
Tax History Compared to Growth
Tax History
| Year | Tax Paid | Tax Assessment Tax Assessment Total Assessment is a certain percentage of the fair market value that is determined by local assessors to be the total taxable value of land and additions on the property. | Land | Improvement |
|---|---|---|---|---|
| 2025 | $9,606 | $802,608 | $633,328 | $169,280 |
| 2024 | $9,606 | $786,871 | $620,910 | $165,961 |
| 2023 | $9,419 | $771,443 | $608,736 | $162,707 |
| 2022 | $8,978 | $756,317 | $596,800 | $159,517 |
| 2021 | $8,866 | $741,489 | $585,099 | $156,390 |
| 2019 | $8,597 | $719,498 | $567,746 | $151,752 |
| 2018 | $8,512 | $705,391 | $556,614 | $148,777 |
| 2016 | $8,131 | $678,000 | $535,000 | $143,000 |
| 2015 | $7,267 | $598,370 | $428,798 | $169,572 |
| 2014 | $7,294 | $586,650 | $420,399 | $166,251 |
Source: Public Records
Map
Nearby Homes
- 4829 Whitsett Ave Unit 301
- 12614 Morrison St
- 12518 Addison St
- 12406 La Maida St
- 12449 Kling St Unit PH2
- 12504 Kling St
- 12701 Kling St
- 5013 Bellaire Ave
- 5032 Bluebell Ave
- 5101 Whitsett Ave Unit 105
- 4640 Laurelgrove Ave
- 12256 Riverside Dr
- 4838 Coldwater Canyon Ave
- 4961 Alcove Ave
- 12227 La Maida St
- 5020 Alcove Ave
- 4609 Goodland Ave
- 4859 Coldwater Canyon Ave Unit 12
- 4859 Coldwater Canyon Ave Unit 4
- 12420 Milbank St
- 4829 Beeman Ave
- 4839 Beeman Ave
- 4825 Beeman Ave
- 4845 Beeman Ave
- 4834 Beeman Ave
- 4851 Beeman Ave
- 4821 Beeman Ave
- 4826 Beeman Ave
- 4857 Beeman Ave
- 4820 Beeman Ave
- 12540 Huston St
- 12560 Huston St
- 12536 Huston St
- 12530 Huston St
- 12552 Huston St
- 12558 Huston St
- 12522 Huston St
- 12600 Huston St
- 12564 Huston St
- 4829 Whitsett Ave Unit 205