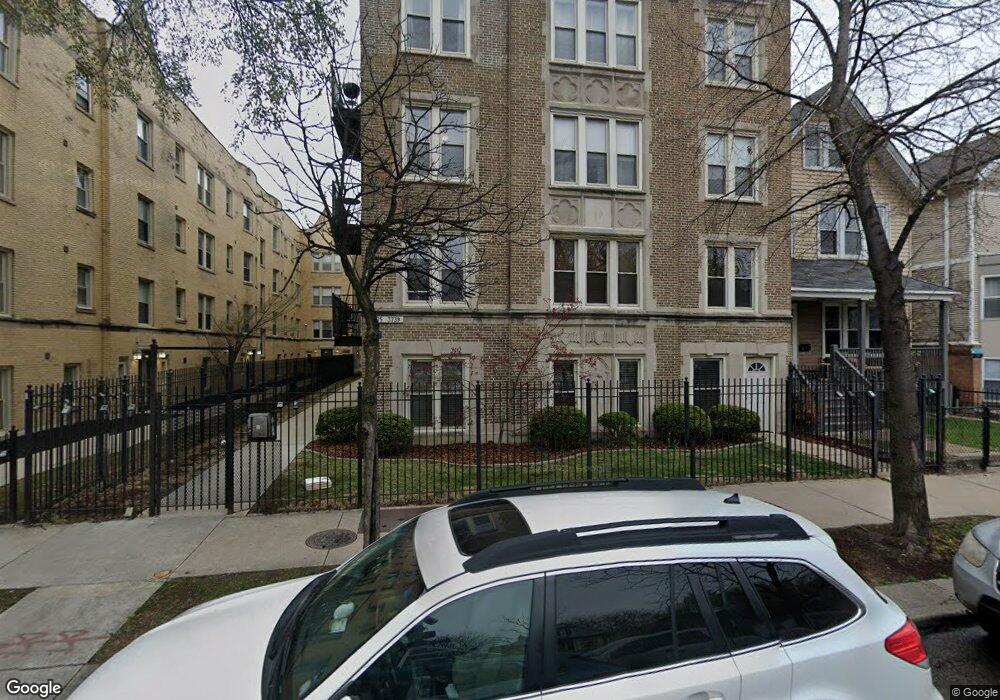
4835 N Ashland Ave Unit 48351E Chicago, IL 60640
Ravenswood NeighborhoodEstimated Value: $295,621 - $300,000
2
Beds
1
Bath
900
Sq Ft
$330/Sq Ft
Est. Value
About This Home
This home is located at 4835 N Ashland Ave Unit 48351E, Chicago, IL 60640 and is currently estimated at $296,905, approximately $329 per square foot. 4835 N Ashland Ave Unit 48351E is a home located in Cook County with nearby schools including McPherson Elementary School, Senn High School, and Chicago Waldorf School.
Ownership History
Date
Name
Owned For
Owner Type
Purchase Details
Closed on
Sep 4, 2020
Sold by
Toushin Elizabeth and Toushin Greg
Bought by
Mackevicius Claire
Current Estimated Value
Home Financials for this Owner
Home Financials are based on the most recent Mortgage that was taken out on this home.
Original Mortgage
$157,500
Interest Rate
2.62%
Mortgage Type
New Conventional
Purchase Details
Closed on
Jun 18, 2010
Sold by
Calderone Dana N
Bought by
Ehorn Elizabeth M and Ehorn Richard G
Home Financials for this Owner
Home Financials are based on the most recent Mortgage that was taken out on this home.
Original Mortgage
$180,000
Interest Rate
4.86%
Mortgage Type
New Conventional
Purchase Details
Closed on
May 28, 2008
Sold by
Schaefer Building Corp
Bought by
Calderone Dana N
Home Financials for this Owner
Home Financials are based on the most recent Mortgage that was taken out on this home.
Original Mortgage
$192,000
Interest Rate
4.87%
Mortgage Type
New Conventional
Create a Home Valuation Report for This Property
The Home Valuation Report is an in-depth analysis detailing your home's value as well as a comparison with similar homes in the area
Home Values in the Area
Average Home Value in this Area
Purchase History
| Date | Buyer | Sale Price | Title Company |
|---|---|---|---|
| Mackevicius Claire | $210,000 | Chicago Title | |
| Ehorn Elizabeth M | $225,000 | First American Title Ins Co | |
| Calderone Dana N | $230,000 | Multiple |
Source: Public Records
Mortgage History
| Date | Status | Borrower | Loan Amount |
|---|---|---|---|
| Previous Owner | Mackevicius Claire | $157,500 | |
| Previous Owner | Ehorn Elizabeth M | $180,000 | |
| Previous Owner | Calderone Dana N | $192,000 |
Source: Public Records
Tax History Compared to Growth
Tax History
| Year | Tax Paid | Tax Assessment Tax Assessment Total Assessment is a certain percentage of the fair market value that is determined by local assessors to be the total taxable value of land and additions on the property. | Land | Improvement |
|---|---|---|---|---|
| 2024 | $3,731 | $23,256 | $4,326 | $18,930 |
| 2023 | $3,616 | $21,000 | $3,478 | $17,522 |
| 2022 | $3,616 | $21,000 | $3,478 | $17,522 |
| 2021 | $3,553 | $20,999 | $3,478 | $17,521 |
| 2020 | $3,472 | $18,686 | $2,086 | $16,600 |
| 2019 | $3,452 | $20,612 | $2,086 | $18,526 |
| 2018 | $3,393 | $20,612 | $2,086 | $18,526 |
| 2017 | $2,759 | $16,192 | $1,825 | $14,367 |
| 2016 | $2,743 | $16,192 | $1,825 | $14,367 |
| 2015 | $2,486 | $16,192 | $1,825 | $14,367 |
| 2014 | $3,042 | $18,964 | $1,402 | $17,562 |
| 2013 | $2,971 | $18,964 | $1,402 | $17,562 |
Source: Public Records
Map
Nearby Homes
- 4911 N Ashland Ave
- 4854 N Paulina St Unit 1W
- 4856 N Paulina St Unit 3W
- 4831 N Hermitage Ave Unit 3B
- 4831 N Hermitage 3b Ave
- 4717 N Paulina St
- 4700 N Ashland Ave Unit 6
- 4752 N Beacon St
- 4748 N Beacon St
- 4646 N Greenview Ave Unit 25
- 1433 W Winnemac Ave
- 1459 W Leland Ave Unit 3
- 1716 W Leland Ave Unit 2F
- 5049 N Ashland Ave
- 1705 W Leland Ave
- 4710 N Beacon St Unit 2S
- 1457 W Carmen Ave Unit 3
- 4745 N Ravenswood Ave Unit 210
- 4745 N Ravenswood Ave Unit 113
- 4625 N Paulina St
- 4835 N Ashland Ave Unit 4837-3
- 4835 N Ashland Ave Unit 48353E
- 4835 N Ashland Ave Unit 48352E
- 4835 N Ashland Ave Unit 4835GE
- 4835 N Ashland Ave Unit 48353W
- 4835 N Ashland Ave Unit 48352W
- 4835 N Ashland Ave Unit 48351W
- 4835 N Ashland Ave Unit 4835GW
- 4835 N Ashland Ave Unit 3W
- 4835 N Ashland Ave Unit GE
- 4835 N Ashland Ave Unit 2W
- 4835 N Ashland Ave Unit 2E
- 4835 N Ashland Ave Unit 1E
- 4835 N Ashland Ave Unit 1W
- 4835 N Ashland Ave Unit GW
- 4833 N Ashland Ave
- 4833 N Ashland Ave Unit 2
- 4841 N Ashland Ave Unit 1C
- 4841 N Ashland Ave Unit 1D
- 4841 N Ashland Ave Unit 2E