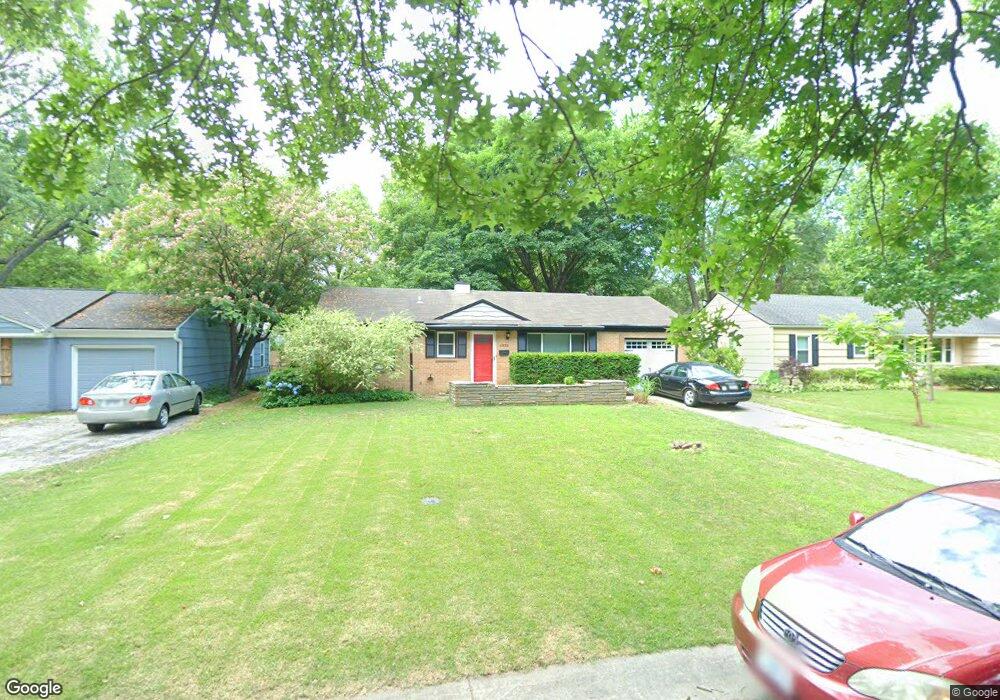
4835 W 62nd Terrace Mission, KS 66205
Estimated Value: $293,000 - $321,574
3
Beds
2
Baths
912
Sq Ft
$338/Sq Ft
Est. Value
About This Home
This home is located at 4835 W 62nd Terrace, Mission, KS 66205 and is currently estimated at $308,644, approximately $338 per square foot. 4835 W 62nd Terrace is a home located in Johnson County with nearby schools including Highlands Elementary School, Indian Hills Middle School, and Shawnee Mission East High School.
Ownership History
Date
Name
Owned For
Owner Type
Purchase Details
Closed on
Feb 9, 2011
Sold by
Giffin Susan
Bought by
Culkin Jared R
Current Estimated Value
Home Financials for this Owner
Home Financials are based on the most recent Mortgage that was taken out on this home.
Original Mortgage
$98,400
Outstanding Balance
$67,588
Interest Rate
4.86%
Mortgage Type
New Conventional
Estimated Equity
$241,056
Purchase Details
Closed on
Mar 11, 2010
Sold by
Waters Susan
Bought by
Waters Susan
Purchase Details
Closed on
Nov 13, 2009
Sold by
Waters James A
Bought by
Waters Susan J
Purchase Details
Closed on
Sep 24, 2001
Sold by
Carlson Jennifer L
Bought by
Waters James A and Waters Susan J
Home Financials for this Owner
Home Financials are based on the most recent Mortgage that was taken out on this home.
Original Mortgage
$102,100
Interest Rate
6.88%
Create a Home Valuation Report for This Property
The Home Valuation Report is an in-depth analysis detailing your home's value as well as a comparison with similar homes in the area
Home Values in the Area
Average Home Value in this Area
Purchase History
| Date | Buyer | Sale Price | Title Company |
|---|---|---|---|
| Culkin Jared R | -- | Assured Quality Title Co | |
| Waters Susan | -- | None Available | |
| Waters Susan J | -- | None Available | |
| Waters James A | -- | Security Land Title Company |
Source: Public Records
Mortgage History
| Date | Status | Borrower | Loan Amount |
|---|---|---|---|
| Open | Culkin Jared R | $98,400 | |
| Previous Owner | Waters James A | $102,100 |
Source: Public Records
Tax History Compared to Growth
Tax History
| Year | Tax Paid | Tax Assessment Tax Assessment Total Assessment is a certain percentage of the fair market value that is determined by local assessors to be the total taxable value of land and additions on the property. | Land | Improvement |
|---|---|---|---|---|
| 2024 | $3,717 | $29,578 | $8,351 | $21,227 |
| 2023 | $3,707 | $28,899 | $7,585 | $21,314 |
| 2022 | $3,352 | $26,266 | $6,893 | $19,373 |
| 2021 | $3,085 | $22,632 | $5,748 | $16,884 |
| 2020 | $2,961 | $21,241 | $4,996 | $16,245 |
| 2019 | $2,621 | $18,319 | $3,121 | $15,198 |
| 2018 | $2,459 | $16,778 | $3,121 | $13,657 |
| 2017 | $2,401 | $16,088 | $3,121 | $12,967 |
| 2016 | $2,262 | $14,789 | $3,121 | $11,668 |
| 2015 | $2,189 | $14,271 | $3,121 | $11,150 |
| 2013 | -- | $13,524 | $3,121 | $10,403 |
Source: Public Records
Map
Nearby Homes
- 6241 Rosewood Ct
- 6247 Rosewood St
- 6234 Ash St
- 5111 W 64th St
- 6316 Granada Dr
- 6108 Fontana St
- 5940 Nall Ave
- 5013 W 65th Terrace
- 4811 W 65th Terrace
- 6000 Maple St
- 6500 Nall Ave
- 4402 W 63rd Terrace
- 6015 Fontana St
- 5214 W 66th Terrace
- 4805 W 66th St
- 6101 El Monte St
- 5914 Granada St
- 4607 W 59th St
- 6000 El Monte St
- 6301 Woodson Dr
- 4829 W 62nd Terrace
- 4841 W 62nd Terrace
- 4823 W 62nd Terrace
- 4845 W 62nd Terrace
- 4832 W 63rd St
- 4838 W 63rd St
- 4826 W 63rd St
- 4844 W 63rd St
- 4834 W 62nd Terrace
- 4817 W 62nd Terrace
- 4828 W 62nd Terrace
- 4840 W 62nd Terrace
- 4820 W 63rd St
- 4822 W 62nd Terrace
- 4844 W 62nd Terrace
- 4811 W 62nd Terrace
- 4816 W 62nd Terrace
- 4814 W 63rd St
- 5433 Hodges Dr
- 6216 Hodges Dr