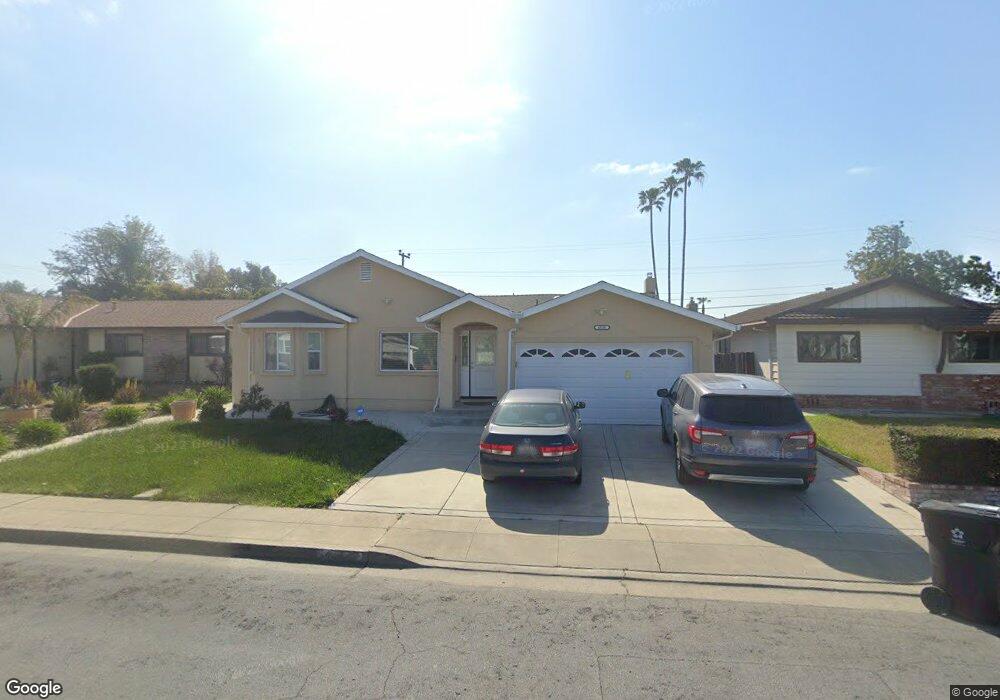
4836 Seneca Park Ave Fremont, CA 94538
Blacow NeighborhoodEstimated Value: $1,559,000 - $1,821,000
3
Beds
2
Baths
1,285
Sq Ft
$1,289/Sq Ft
Est. Value
About This Home
This home is located at 4836 Seneca Park Ave, Fremont, CA 94538 and is currently estimated at $1,655,723, approximately $1,288 per square foot. 4836 Seneca Park Ave is a home located in Alameda County with nearby schools including Steven Millard Elementary, G.M. Walters Middle School, and John F. Kennedy High School.
Ownership History
Date
Name
Owned For
Owner Type
Purchase Details
Closed on
Oct 21, 2011
Sold by
Phangura Ripandeep K and Phangura Kamaljit S
Bought by
Phangura Ripandeep K and Phangura Kamaljit S
Current Estimated Value
Home Financials for this Owner
Home Financials are based on the most recent Mortgage that was taken out on this home.
Original Mortgage
$330,000
Outstanding Balance
$224,094
Interest Rate
4.01%
Mortgage Type
New Conventional
Estimated Equity
$1,431,629
Purchase Details
Closed on
Oct 11, 2010
Sold by
Huddleston Bill G
Bought by
Phangura Ripandeep and Phangura Kamaljit
Home Financials for this Owner
Home Financials are based on the most recent Mortgage that was taken out on this home.
Original Mortgage
$334,500
Interest Rate
4.26%
Mortgage Type
New Conventional
Create a Home Valuation Report for This Property
The Home Valuation Report is an in-depth analysis detailing your home's value as well as a comparison with similar homes in the area
Home Values in the Area
Average Home Value in this Area
Purchase History
| Date | Buyer | Sale Price | Title Company |
|---|---|---|---|
| Phangura Ripandeep K | -- | Chicago Title Company | |
| Phangura Ripandeep | $446,000 | Old Republic Title Company |
Source: Public Records
Mortgage History
| Date | Status | Borrower | Loan Amount |
|---|---|---|---|
| Open | Phangura Ripandeep K | $330,000 | |
| Closed | Phangura Ripandeep | $334,500 |
Source: Public Records
Tax History Compared to Growth
Tax History
| Year | Tax Paid | Tax Assessment Tax Assessment Total Assessment is a certain percentage of the fair market value that is determined by local assessors to be the total taxable value of land and additions on the property. | Land | Improvement |
|---|---|---|---|---|
| 2025 | $8,253 | $668,820 | $171,411 | $504,409 |
| 2024 | $8,253 | $655,573 | $168,051 | $494,522 |
| 2023 | $8,026 | $649,585 | $164,757 | $484,828 |
| 2022 | $7,915 | $629,850 | $161,527 | $475,323 |
| 2021 | $7,722 | $617,364 | $158,360 | $466,004 |
| 2020 | $7,722 | $617,965 | $156,737 | $461,228 |
| 2019 | $7,634 | $605,853 | $153,665 | $452,188 |
| 2018 | $7,484 | $593,977 | $150,653 | $443,324 |
| 2017 | $7,296 | $582,334 | $147,700 | $434,634 |
| 2016 | $6,136 | $482,683 | $144,805 | $337,878 |
| 2015 | $6,049 | $475,435 | $142,630 | $332,805 |
| 2014 | $5,940 | $466,123 | $139,837 | $326,286 |
Source: Public Records
Map
Nearby Homes
- 43163 Grimmer Terrace
- 4860 Bryce Canyon Park Dr
- 42932 Peachwood St
- 48 Eagle Green
- 4537 Capewood Terrace
- 4533 Capewood Terrace
- 92 Delta Green
- 5341 Audubon Park Ct
- 4309 Bora Ave
- 5560 Boscell Common
- 4751 Wadsworth Ct
- 202 Manitoba Terrace
- 262 Manitoba Green
- 208 Manitoba Terrace
- 41882 Gifford St
- 261 Manitoba Green Unit 261
- 257 Manitoba Green
- 40696 Robin St
- 40422 Landon Ave
- 42759 Newport Dr
- 4844 Seneca Park Ave
- 4830 Seneca Park Ave
- 4876 Regents Park Ln
- 4852 Seneca Park Ave
- 4824 Seneca Park Ave
- 4872 Regents Park Ln
- 4837 Seneca Park Ave
- 4882 Regents Park Ln
- 4845 Seneca Park Ave
- 4831 Seneca Park Ave
- 4860 Seneca Park Ave
- 4816 Seneca Park Ave
- 4853 Seneca Park Ave
- 4823 Seneca Park Ave
- 4868 Regents Park Ln
- 4886 Regents Park Ln
- 4859 Seneca Park Ave
- 4815 Seneca Park Ave
- 4866 Seneca Park Ave
- 4808 Seneca Park Ave