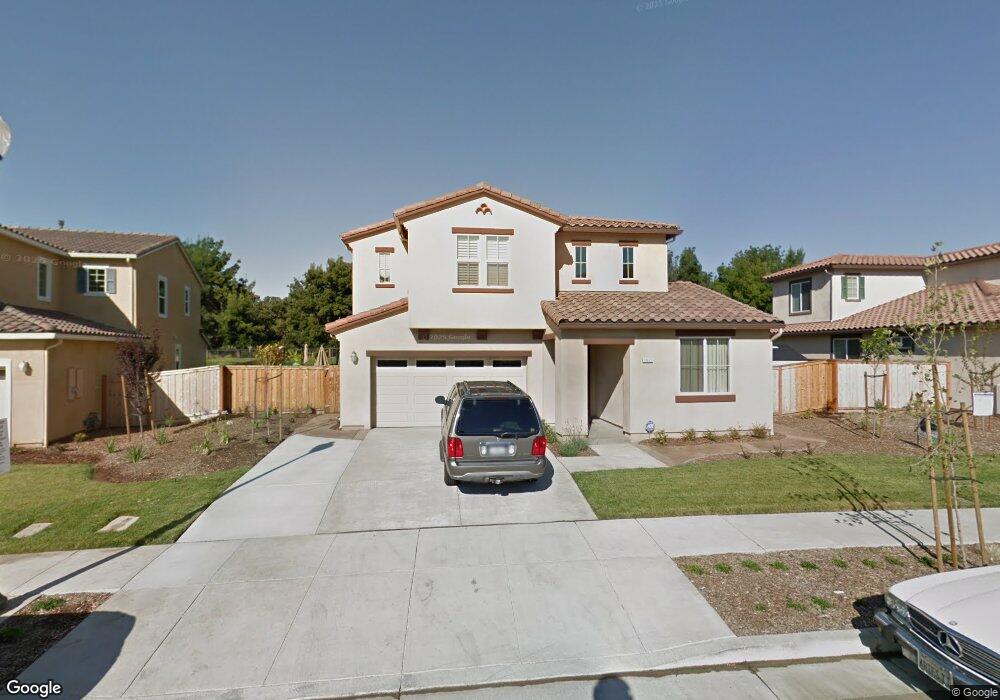
4837 Duval St Fairfield, CA 94533
Estimated Value: $864,000 - $872,000
4
Beds
3
Baths
3,048
Sq Ft
$285/Sq Ft
Est. Value
About This Home
This home is located at 4837 Duval St, Fairfield, CA 94533 and is currently estimated at $868,358, approximately $284 per square foot. 4837 Duval St is a home with nearby schools including Rolling Hills Elementary School, Fairfield High School, and Fairfield Christian School.
Ownership History
Date
Name
Owned For
Owner Type
Purchase Details
Closed on
Jul 31, 2025
Sold by
Sylvia L Hyde Revocable Living Trust and Hyde Sylvia L
Bought by
Pauline Sentell Revocable Living Trust and Diggs
Current Estimated Value
Purchase Details
Closed on
Dec 4, 2024
Sold by
Pauline Sentell Revocable Living Trust and Diggs Pauline
Bought by
Hyde Sylvia L and Hyde
Purchase Details
Closed on
Nov 22, 2016
Sold by
Diggs Pauline and Hyde Sylvia L
Bought by
Diggs Pauline and The Pauline Sentell Revocable
Home Financials for this Owner
Home Financials are based on the most recent Mortgage that was taken out on this home.
Original Mortgage
$75,000
Interest Rate
3.57%
Mortgage Type
New Conventional
Purchase Details
Closed on
Nov 24, 2010
Sold by
William Lyon Homes Inc
Bought by
Diggs Pauline and The Pauline Sentell Revocable
Create a Home Valuation Report for This Property
The Home Valuation Report is an in-depth analysis detailing your home's value as well as a comparison with similar homes in the area
Home Values in the Area
Average Home Value in this Area
Purchase History
| Date | Buyer | Sale Price | Title Company |
|---|---|---|---|
| Pauline Sentell Revocable Living Trust | -- | None Listed On Document | |
| Hyde Sylvia L | -- | None Listed On Document | |
| Sylvia L Hyde Revocable Living Trust | -- | None Listed On Document | |
| Hyde Sylvia L | -- | None Listed On Document | |
| Diggs Pauline | -- | Title 365 Company | |
| Diggs Pauline | $37,500 | Title365 Company | |
| Diggs Pauline | $547,500 | First American Title Company |
Source: Public Records
Mortgage History
| Date | Status | Borrower | Loan Amount |
|---|---|---|---|
| Previous Owner | Diggs Pauline | $75,000 |
Source: Public Records
Tax History
| Year | Tax Paid | Tax Assessment Tax Assessment Total Assessment is a certain percentage of the fair market value that is determined by local assessors to be the total taxable value of land and additions on the property. | Land | Improvement |
|---|---|---|---|---|
| 2025 | $8,785 | $773,660 | $179,272 | $594,388 |
| 2024 | $8,785 | $698,357 | $163,282 | $535,075 |
| 2023 | $8,526 | $684,665 | $160,081 | $524,584 |
| 2022 | $8,226 | $671,242 | $156,943 | $514,299 |
| 2021 | $8,688 | $658,081 | $153,866 | $504,215 |
| 2020 | $9,190 | $651,334 | $152,289 | $499,045 |
| 2019 | $9,009 | $638,563 | $149,303 | $489,260 |
| 2018 | $9,197 | $626,043 | $146,376 | $479,667 |
| 2017 | $9,094 | $613,768 | $143,506 | $470,262 |
| 2016 | $8,982 | $601,735 | $140,693 | $461,042 |
| 2015 | $8,498 | $592,697 | $138,580 | $454,117 |
| 2014 | $7,653 | $581,088 | $135,866 | $445,222 |
Source: Public Records
Map
Nearby Homes
- 4488 Avondale Cir
- 4595 Avondale Cir
- 4124 Singletree Way
- 1602 Copley Ct
- 4017 The Masters Dr Unit 1
- 4013 The Masters Dr Unit 1
- 702 Racoon Ct
- 738 Marsh Place
- 3826 Danbury Way
- 3442 Glen Ellen Dr
- 3276 Arroyo Dr
- 3265 Arroyo Dr
- 538 Royal National Rd
- 532 Royal National Rd
- 526 Royal National Rd
- Residence 3 Plan at Lagoon Valley - Hawthorn Hills
- Residence 1 Plan at Lagoon Valley - Hawthorn Hills
- Residence 5 Plan at Lagoon Valley - Hawthorn Hills
- Residence 2 Plan at Lagoon Valley - Hawthorn Hills
- Residence 4 Plan at Lagoon Valley - Hawthorn Hills