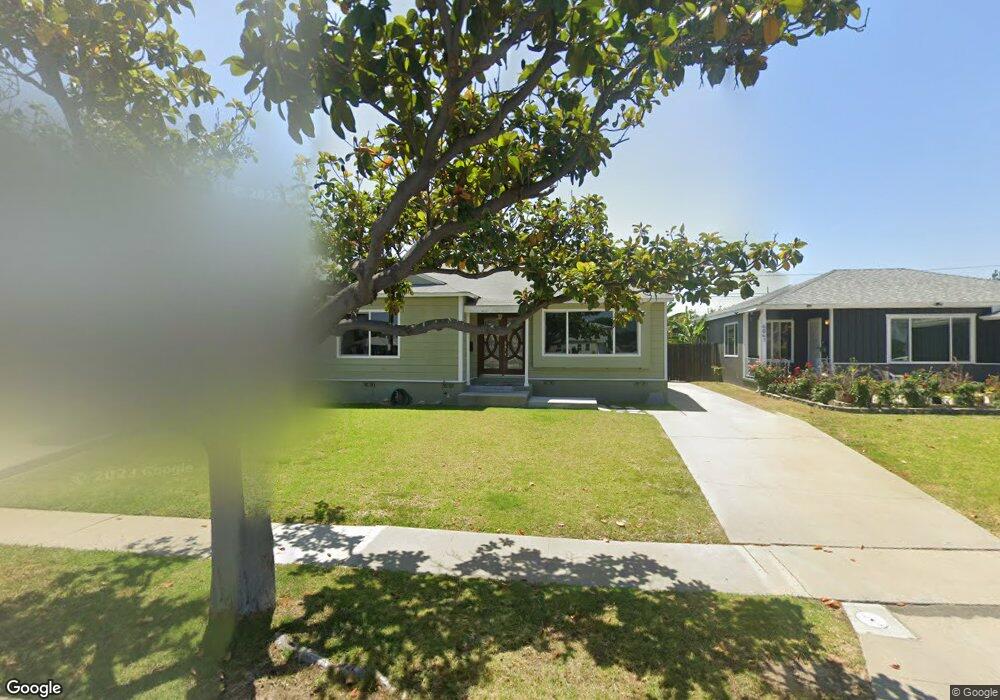
4837 Lakewood Blvd Lakewood, CA 90712
Lakewood Mutual NeighborhoodEstimated Value: $811,670 - $887,000
3
Beds
1
Bath
1,210
Sq Ft
$709/Sq Ft
Est. Value
About This Home
This home is located at 4837 Lakewood Blvd, Lakewood, CA 90712 and is currently estimated at $858,168, approximately $709 per square foot. 4837 Lakewood Blvd is a home located in Los Angeles County with nearby schools including Riley Elementary School, Hoover Middle School, and Lakewood High School.
Ownership History
Date
Name
Owned For
Owner Type
Purchase Details
Closed on
Jun 23, 2009
Sold by
Citimortgage Inc
Bought by
Nunez Alicia
Current Estimated Value
Home Financials for this Owner
Home Financials are based on the most recent Mortgage that was taken out on this home.
Original Mortgage
$313,222
Outstanding Balance
$203,592
Interest Rate
5.31%
Mortgage Type
FHA
Estimated Equity
$654,576
Purchase Details
Closed on
Jan 5, 2009
Sold by
Clark Neal and Clark Veronica M
Bought by
Us Bank and Cmalt Remic 2007-A2 Praa
Purchase Details
Closed on
Oct 30, 2004
Sold by
Clark Neal and Clark Veronica M
Bought by
Clark Neal
Home Financials for this Owner
Home Financials are based on the most recent Mortgage that was taken out on this home.
Original Mortgage
$273,000
Interest Rate
5.7%
Mortgage Type
New Conventional
Create a Home Valuation Report for This Property
The Home Valuation Report is an in-depth analysis detailing your home's value as well as a comparison with similar homes in the area
Home Values in the Area
Average Home Value in this Area
Purchase History
| Date | Buyer | Sale Price | Title Company |
|---|---|---|---|
| Nunez Alicia | $319,000 | First American Title Ins Co | |
| Citimortgage Inc | -- | First American Title Ins Co | |
| Us Bank | $369,000 | First American Title Ins Co | |
| Clark Neal | -- | -- |
Source: Public Records
Mortgage History
| Date | Status | Borrower | Loan Amount |
|---|---|---|---|
| Open | Nunez Alicia | $313,222 | |
| Previous Owner | Clark Neal | $273,000 |
Source: Public Records
Tax History Compared to Growth
Tax History
| Year | Tax Paid | Tax Assessment Tax Assessment Total Assessment is a certain percentage of the fair market value that is determined by local assessors to be the total taxable value of land and additions on the property. | Land | Improvement |
|---|---|---|---|---|
| 2025 | $5,615 | $411,756 | $322,697 | $89,059 |
| 2024 | $5,615 | $403,683 | $316,370 | $87,313 |
| 2023 | $5,522 | $395,768 | $310,167 | $85,601 |
| 2022 | $5,195 | $388,009 | $304,086 | $83,923 |
| 2021 | $5,092 | $380,402 | $298,124 | $82,278 |
| 2019 | $5,018 | $369,122 | $289,283 | $79,839 |
| 2018 | $4,823 | $361,885 | $283,611 | $78,274 |
| 2016 | $4,443 | $347,835 | $272,599 | $75,236 |
| 2015 | $4,272 | $342,611 | $268,505 | $74,106 |
| 2014 | $4,245 | $335,901 | $263,246 | $72,655 |
Source: Public Records
Map
Nearby Homes
- 4848 Oliva Ave
- 4740 Pepperwood Ave
- 4944 Coke Ave
- 3638 Sandwood St
- 4808 Graywood Ave
- 4851 Faculty Ave
- 4826 Faculty Ave
- 4532 Pepperwood Ave
- 4520 Pepperwood Ave
- 4704 E Centralia St
- 4121 Country Club Dr
- 3244 Centralia St
- 4839 Premiere Ave
- 2922 Eckleson St
- 2912 Allred St
- 2912 Yearling St
- 4559 Levelside Ave
- 5202 Fidler Ave
- 5602 Verdura Ave
- 5503 Sunfield Ave
- 4831 Lakewood Blvd
- 4841 Lakewood Blvd
- 4827 Lakewood Blvd
- 4836 Pimenta Ave
- 4842 Pimenta Ave
- 4832 Pimenta Ave
- 4828 Pimenta Ave
- 4848 Pimenta Ave
- 4823 Lakewood Blvd
- 4851 Lakewood Blvd
- 4852 Pimenta Ave
- 4822 Pimenta Ave
- 4817 Lakewood Blvd
- 4857 Lakewood Blvd
- 4816 Pimenta Ave
- 4858 Pimenta Ave
- 4811 Lakewood Blvd
- 4863 Lakewood Blvd
- 4839 Pimenta Ave
- 4812 Pimenta Ave