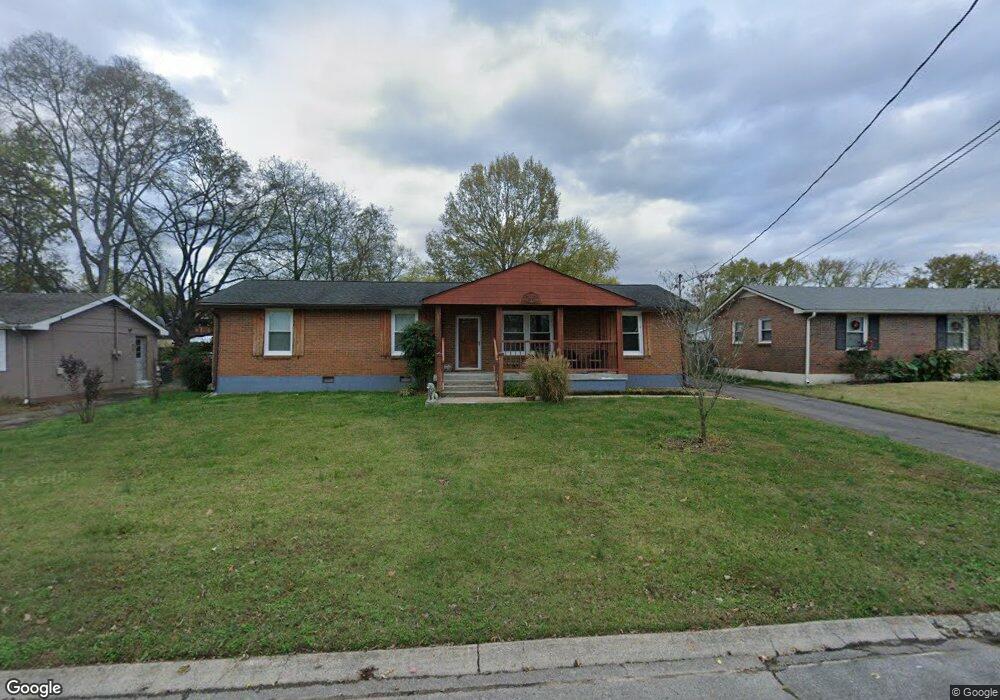
4837 Whittier Dr Old Hickory, TN 37138
Hermitage NeighborhoodEstimated Value: $301,101 - $344,000
3
Beds
2
Baths
1,100
Sq Ft
$300/Sq Ft
Est. Value
About This Home
This home is located at 4837 Whittier Dr, Old Hickory, TN 37138 and is currently estimated at $329,775, approximately $299 per square foot. 4837 Whittier Dr is a home located in Davidson County with nearby schools including Andrew Jackson Elementary School, Dupont-Hadley Middle School, and McGavock High School.
Ownership History
Date
Name
Owned For
Owner Type
Purchase Details
Closed on
Jul 21, 2010
Sold by
Davis John R
Bought by
Pomfrett Charles Frederick
Current Estimated Value
Home Financials for this Owner
Home Financials are based on the most recent Mortgage that was taken out on this home.
Original Mortgage
$50,000
Outstanding Balance
$33,242
Interest Rate
4.73%
Mortgage Type
New Conventional
Estimated Equity
$296,533
Purchase Details
Closed on
Feb 22, 2002
Sold by
Durr Tracey L and Durr William R
Bought by
Davis John R
Home Financials for this Owner
Home Financials are based on the most recent Mortgage that was taken out on this home.
Original Mortgage
$89,910
Interest Rate
6.81%
Purchase Details
Closed on
Jun 24, 1998
Sold by
Guye Lesley G
Bought by
Durr Tracey L
Home Financials for this Owner
Home Financials are based on the most recent Mortgage that was taken out on this home.
Original Mortgage
$87,962
Interest Rate
7.1%
Create a Home Valuation Report for This Property
The Home Valuation Report is an in-depth analysis detailing your home's value as well as a comparison with similar homes in the area
Home Values in the Area
Average Home Value in this Area
Purchase History
| Date | Buyer | Sale Price | Title Company |
|---|---|---|---|
| Pomfrett Charles Frederick | $106,500 | Cumberland Title | |
| Davis John R | $99,900 | Advantage Title & Escrow | |
| Durr Tracey L | $89,900 | -- |
Source: Public Records
Mortgage History
| Date | Status | Borrower | Loan Amount |
|---|---|---|---|
| Open | Pomfrett Charles Frederick | $50,000 | |
| Previous Owner | Davis John R | $89,910 | |
| Previous Owner | Durr Tracey L | $87,962 |
Source: Public Records
Tax History Compared to Growth
Tax History
| Year | Tax Paid | Tax Assessment Tax Assessment Total Assessment is a certain percentage of the fair market value that is determined by local assessors to be the total taxable value of land and additions on the property. | Land | Improvement |
|---|---|---|---|---|
| 2024 | $1,544 | $52,850 | $12,500 | $40,350 |
| 2023 | $1,544 | $52,850 | $12,500 | $40,350 |
| 2022 | $2,002 | $52,850 | $12,500 | $40,350 |
| 2021 | $1,561 | $52,850 | $12,500 | $40,350 |
| 2020 | $1,403 | $37,050 | $8,750 | $28,300 |
| 2019 | $935 | $37,050 | $8,750 | $28,300 |
| 2018 | $935 | $37,050 | $8,750 | $28,300 |
| 2017 | $0 | $37,050 | $8,750 | $28,300 |
| 2016 | $1,032 | $26,300 | $6,250 | $20,050 |
| 2015 | $1,032 | $26,300 | $6,250 | $20,050 |
| 2014 | $935 | $26,300 | $6,250 | $20,050 |
Source: Public Records
Map
Nearby Homes
- 4852 Everest Dr
- 4741 Cascade Dr
- 4768 Cascade Dr
- 4840 Shasta Dr
- 4924 Whittier Dr
- 21 Shshone Ct
- 1884 Brookmeadow Ln
- 1869 Brookmeadow Ln
- 222 Blue Ridge Dr
- 2309 Crescent Valley Place
- 310 Santa Rosa Dr
- 301 Griffin Place Unit 118
- 604 Weatherbeaten Place Unit 604
- 1033 Wyntergrace Farm Rd
- 516 Griffin Cir Unit 22
- 104 Saddle Tree Ct
- 1813 Woodland Farms Ct
- 220 Harpers Mill Ct Unit 220
- 632 Rehnea Dr Unit 132
- 1320 Autumn Springs Ln
- 4841 Whittier Dr
- 4833 Whittier Dr
- 4829 Whittier Dr
- 4845 Whittier Dr
- 4820 Everest Dr
- 4816 Everest Dr
- 4824 Everest Dr
- 4812 Everest Dr
- 4848 Whittier Dr
- 4825 Whittier Dr
- 4849 Whittier Dr
- 4856 Whittier Dr
- 4852 Whittier Dr
- 4844 Whittier Dr
- 4828 Everest Dr
- 4808 Everest Dr
- 4860 Whittier Dr
- 4864 Whittier Dr
- 4821 Whittier Dr
- 4853 Whittier Dr