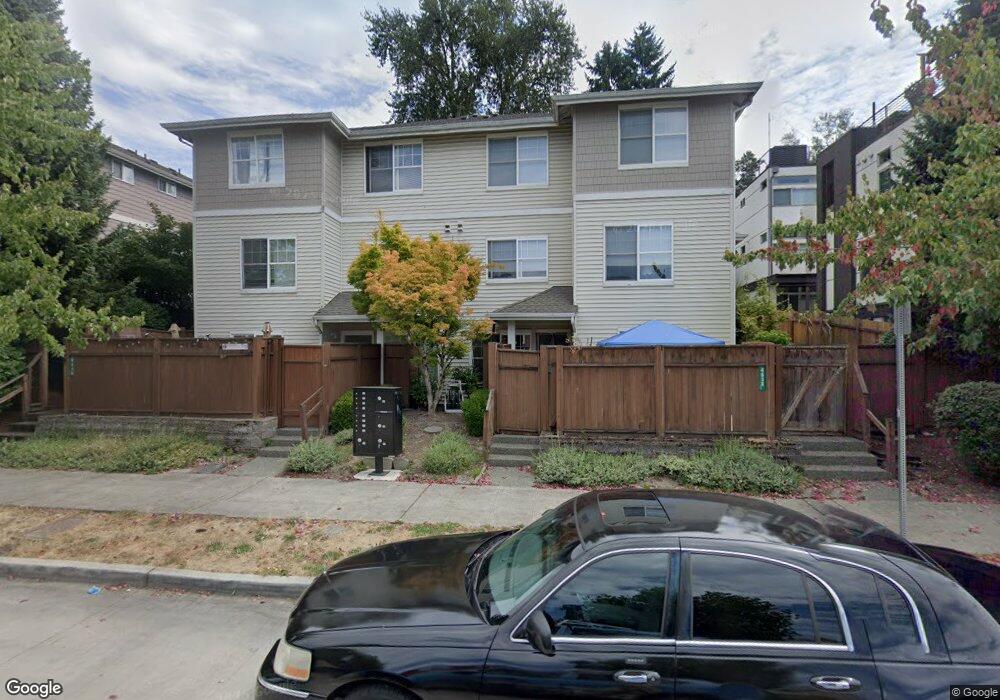
4838 Delridge Way SW Unit D Seattle, WA 98106
North Delridge NeighborhoodEstimated Value: $589,000 - $673,000
3
Beds
4
Baths
1,553
Sq Ft
$408/Sq Ft
Est. Value
About This Home
This home is located at 4838 Delridge Way SW Unit D, Seattle, WA 98106 and is currently estimated at $634,193, approximately $408 per square foot. 4838 Delridge Way SW Unit D is a home located in King County with nearby schools including Fairmount Park Elementary, Madison Middle School, and West Seattle High School.
Ownership History
Date
Name
Owned For
Owner Type
Purchase Details
Closed on
Jan 23, 2007
Sold by
Aravelo Carlos A and Smith Chad M
Bought by
Felema Hamda
Current Estimated Value
Home Financials for this Owner
Home Financials are based on the most recent Mortgage that was taken out on this home.
Original Mortgage
$64,600
Interest Rate
5.91%
Mortgage Type
Stand Alone Second
Purchase Details
Closed on
Feb 27, 2004
Sold by
Johnsen Eric A
Bought by
Arvelo Carlos A and Smith Chad M
Home Financials for this Owner
Home Financials are based on the most recent Mortgage that was taken out on this home.
Original Mortgage
$163,950
Interest Rate
4.75%
Mortgage Type
Purchase Money Mortgage
Purchase Details
Closed on
Oct 31, 2001
Sold by
Lakeville Construction Inc
Bought by
Johnsen Eric A
Home Financials for this Owner
Home Financials are based on the most recent Mortgage that was taken out on this home.
Original Mortgage
$178,600
Interest Rate
6.84%
Create a Home Valuation Report for This Property
The Home Valuation Report is an in-depth analysis detailing your home's value as well as a comparison with similar homes in the area
Home Values in the Area
Average Home Value in this Area
Purchase History
| Date | Buyer | Sale Price | Title Company |
|---|---|---|---|
| Felema Hamda | $323,000 | Stewart Title | |
| Arvelo Carlos A | $204,950 | First American | |
| Johnsen Eric A | $188,000 | Chicago Title |
Source: Public Records
Mortgage History
| Date | Status | Borrower | Loan Amount |
|---|---|---|---|
| Closed | Felema Hamda | $64,600 | |
| Open | Felema Hamda | $258,400 | |
| Previous Owner | Arvelo Carlos A | $163,950 | |
| Previous Owner | Johnsen Eric A | $178,600 | |
| Closed | Arvelo Carlos A | $30,700 |
Source: Public Records
Tax History Compared to Growth
Tax History
| Year | Tax Paid | Tax Assessment Tax Assessment Total Assessment is a certain percentage of the fair market value that is determined by local assessors to be the total taxable value of land and additions on the property. | Land | Improvement |
|---|---|---|---|---|
| 2024 | $5,003 | $509,000 | $173,200 | $335,800 |
| 2023 | $4,294 | $556,000 | $173,200 | $382,800 |
| 2022 | $4,435 | $494,000 | $155,000 | $339,000 |
| 2021 | $4,431 | $472,000 | $142,200 | $329,800 |
| 2020 | $4,305 | $449,000 | $136,800 | $312,200 |
| 2018 | $3,358 | $386,000 | $109,400 | $276,600 |
| 2017 | $2,868 | $330,000 | $100,300 | $229,700 |
| 2016 | $2,573 | $290,000 | $91,200 | $198,800 |
| 2015 | $2,752 | $251,000 | $91,200 | $159,800 |
| 2014 | -- | $278,000 | $45,600 | $232,400 |
| 2013 | -- | $207,000 | $45,600 | $161,400 |
Source: Public Records
Map
Nearby Homes
- 5005 Delridge Way SW
- 5011 Delridge Way SW
- 5033 25th Ave SW Unit A
- 5033 25th Ave SW Unit B
- 5257 23rd Ave SW
- 4572 22nd Ave SW
- 5252 23rd Ave SW
- 2401 SW Brandon St Unit 202
- 4531 26th Ave SW
- 5605 25th Ave SW
- 4411 21st Ave SW
- 4409 21st Ave SW
- 2103 SW Genesee St
- 1501 SW Brandon St Unit 1
- 4111 25th Ave SW Unit LOT C
- 4107 25th Ave SW
- 3221 SW Avalon Way Unit 413
- 3221 SW Avalon Way Unit 207
- 5202 35th Ave SW
- 5451 32nd Ave SW
- 4838 Delridge Way SW Unit F
- 4838 Delridge Way SW Unit C
- 4838 Delridge Way SW Unit B
- 4838 Delridge Way SW Unit A
- 4838 Delridge Way SW Unit E
- 4838 Delridge Way SW
- 4846 Delridge Way SW Unit B
- 4846 Delridge Way SW Unit A
- 4846 Delridge Way SW
- 4834 Delridge Way SW
- 4834 Delridge Way SW Unit A
- 4834 Delridge Way SW Unit B
- 4832 Delridge Way SW
- 4832 Delridge Way SW Unit B
- 4832 Delridge Way SW Unit A
- 4832 Delridge Way SW Unit A
- 4844 Delridge Way SW
- 4844 Delridge Way SW Unit A
- 4850 Delridge Way SW
- 4848 Delridge Way SW