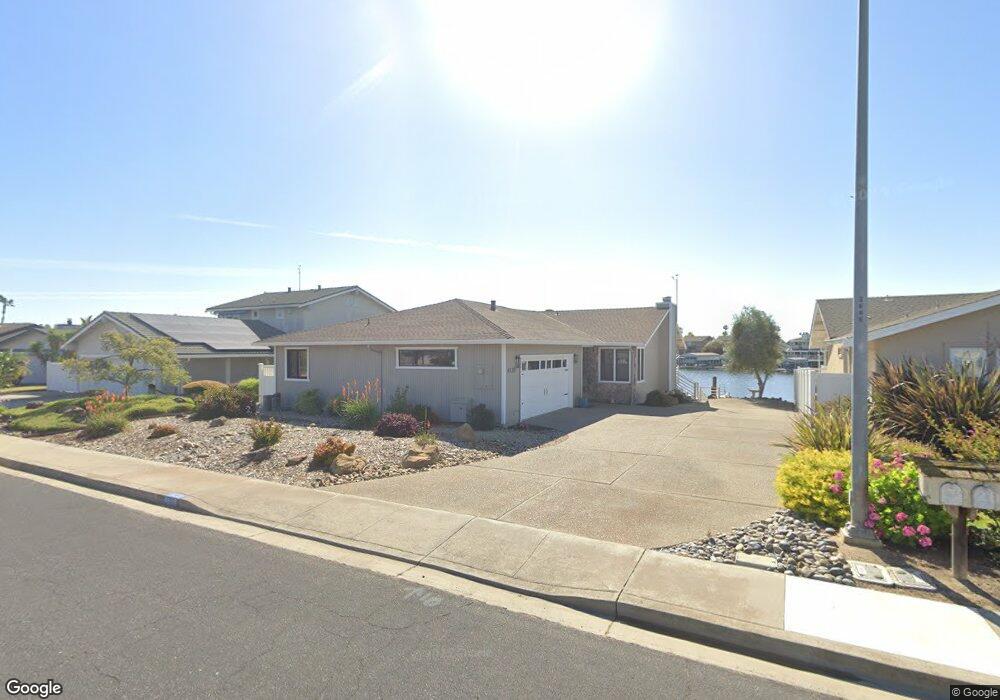
4839 Cabrillo Point Discovery Bay, CA 94505
Estimated Value: $814,671 - $1,217,000
3
Beds
2
Baths
1,763
Sq Ft
$557/Sq Ft
Est. Value
About This Home
This home is located at 4839 Cabrillo Point, Discovery Bay, CA 94505 and is currently estimated at $981,668, approximately $556 per square foot. 4839 Cabrillo Point is a home located in Contra Costa County with nearby schools including Discovery Bay Elementary School, Excelsior Middle School, and Liberty High School.
Ownership History
Date
Name
Owned For
Owner Type
Purchase Details
Closed on
Oct 24, 2024
Sold by
Brewer Milton M and Revoc Margo
Bought by
Milton M Brewer And Margo L Brewer Bypass Tru and Brewer
Current Estimated Value
Purchase Details
Closed on
Jan 31, 2007
Sold by
Brewer Milton M and Brewer Margo L
Bought by
Brewer Milton M and Brewer Margo L
Home Financials for this Owner
Home Financials are based on the most recent Mortgage that was taken out on this home.
Original Mortgage
$300,000
Interest Rate
6.17%
Mortgage Type
Purchase Money Mortgage
Purchase Details
Closed on
Jan 12, 2007
Sold by
Hector Chester B and Hector Barbara J
Bought by
Brewer Milton M and Brewer Margo L
Home Financials for this Owner
Home Financials are based on the most recent Mortgage that was taken out on this home.
Original Mortgage
$300,000
Interest Rate
6.17%
Mortgage Type
Purchase Money Mortgage
Create a Home Valuation Report for This Property
The Home Valuation Report is an in-depth analysis detailing your home's value as well as a comparison with similar homes in the area
Home Values in the Area
Average Home Value in this Area
Purchase History
| Date | Buyer | Sale Price | Title Company |
|---|---|---|---|
| Milton M Brewer And Margo L Brewer Bypass Tru | -- | None Listed On Document | |
| Brewer Milton M | -- | North American Title Co | |
| Brewer Milton M | $700,000 | North American Title Co |
Source: Public Records
Mortgage History
| Date | Status | Borrower | Loan Amount |
|---|---|---|---|
| Previous Owner | Brewer Milton M | $300,000 |
Source: Public Records
Tax History
| Year | Tax Paid | Tax Assessment Tax Assessment Total Assessment is a certain percentage of the fair market value that is determined by local assessors to be the total taxable value of land and additions on the property. | Land | Improvement |
|---|---|---|---|---|
| 2025 | $11,399 | $878,000 | $595,789 | $282,211 |
| 2024 | $10,215 | $872,000 | $591,718 | $280,282 |
| 2023 | $10,215 | $797,500 | $541,164 | $256,336 |
| 2022 | $10,227 | $797,500 | $541,164 | $256,336 |
| 2021 | $8,811 | $673,000 | $456,681 | $216,319 |
| 2019 | $9,202 | $699,000 | $474,323 | $224,677 |
| 2018 | $8,929 | $691,500 | $469,234 | $222,266 |
| 2017 | $8,158 | $623,000 | $422,751 | $200,249 |
| 2016 | $7,950 | $592,000 | $401,715 | $190,285 |
| 2015 | $7,206 | $530,000 | $359,644 | $170,356 |
| 2014 | $6,443 | $462,000 | $313,501 | $148,499 |
Source: Public Records
Map
Nearby Homes
- 4930 Discovery Point
- 5055 Cabrillo Point
- 550 Lee Loop
- 952 Lido Cir
- 4741 Discovery Point
- 1240 Marina Cir
- 4814 South Point
- 1056 Discovery Bay Blvd
- 5034 Double Point Way
- 554 Lee Loop
- 1271 Discovery Bay Blvd
- 1154 Bradbury Dr
- 5260 Laguna Ct
- 1145 Bradbury Dr
- 5090 Double Point Way
- 1065 Bradbury Dr
- 910 Discovery Bay Blvd
- 1205 Beach Ct
- 4475 Discovery Point
- 2079 Sand Point Rd
- 4831 Cabrillo Point
- 4841 Cabrillo Point
- 4829 Cabrillo Point
- 4851 Cabrillo Point
- 4821 Cabrillo Point
- 4838 Cabrillo Point
- 4842 Cabrillo Point
- 4832 Cabrillo Point
- 4811 Cabrillo Point
- 4848 Cabrillo Point
- 4859 Cabrillo Point
- 4828 Cabrillo Point
- 4812 Cabrillo Point
- 4852 Cabrillo Point
- 4822 Cabrillo Point
- 4818 Cabrillo Point
- 4863 Cabrillo Point
- 4858 Cabrillo Point
- 4873 Cabrillo Point
- 4862 Cabrillo Point
Your Personal Tour Guide
Ask me questions while you tour the home.