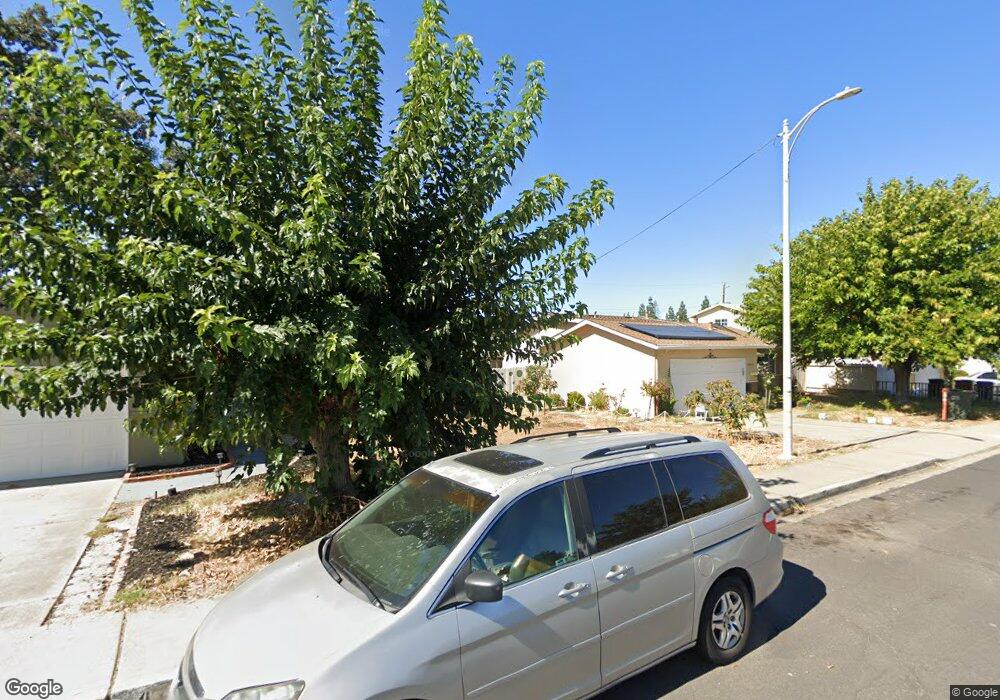
4839 Eagle Way Concord, CA 94521
Midtown Concord NeighborhoodEstimated Value: $403,153 - $598,000
2
Beds
2
Baths
966
Sq Ft
$512/Sq Ft
Est. Value
About This Home
This home is located at 4839 Eagle Way, Concord, CA 94521 and is currently estimated at $495,038, approximately $512 per square foot. 4839 Eagle Way is a home located in Contra Costa County with nearby schools including Silverwood Elementary School, Pine Hollow Middle School, and College Park High School.
Ownership History
Date
Name
Owned For
Owner Type
Purchase Details
Closed on
Nov 3, 2020
Sold by
Lincoln Jane A
Bought by
Lincoln Jane A
Current Estimated Value
Purchase Details
Closed on
Sep 20, 1999
Sold by
Angus Anne M
Bought by
Lincoln Jane A
Home Financials for this Owner
Home Financials are based on the most recent Mortgage that was taken out on this home.
Original Mortgage
$128,646
Outstanding Balance
$38,930
Interest Rate
8.09%
Mortgage Type
Purchase Money Mortgage
Estimated Equity
$456,108
Purchase Details
Closed on
Jul 25, 1994
Sold by
Christensen Donald
Bought by
Angus Anne M
Home Financials for this Owner
Home Financials are based on the most recent Mortgage that was taken out on this home.
Original Mortgage
$93,000
Interest Rate
8.38%
Mortgage Type
Purchase Money Mortgage
Create a Home Valuation Report for This Property
The Home Valuation Report is an in-depth analysis detailing your home's value as well as a comparison with similar homes in the area
Home Values in the Area
Average Home Value in this Area
Purchase History
| Date | Buyer | Sale Price | Title Company |
|---|---|---|---|
| Lincoln Jane A | -- | None Available | |
| Lincoln Jane A | $140,000 | Fidelity National Title Co | |
| Angus Anne M | $120,000 | American Title Insurance Co |
Source: Public Records
Mortgage History
| Date | Status | Borrower | Loan Amount |
|---|---|---|---|
| Open | Lincoln Jane A | $128,646 | |
| Previous Owner | Angus Anne M | $93,000 |
Source: Public Records
Tax History
| Year | Tax Paid | Tax Assessment Tax Assessment Total Assessment is a certain percentage of the fair market value that is determined by local assessors to be the total taxable value of land and additions on the property. | Land | Improvement |
|---|---|---|---|---|
| 2025 | $3,285 | $215,152 | $55,316 | $159,836 |
| 2024 | $3,103 | $210,934 | $54,232 | $156,702 |
| 2023 | $3,103 | $206,799 | $53,169 | $153,630 |
| 2022 | $3,040 | $202,745 | $52,127 | $150,618 |
| 2021 | $2,947 | $198,770 | $51,105 | $147,665 |
| 2019 | $2,876 | $192,876 | $49,590 | $143,286 |
| 2018 | $2,755 | $189,095 | $48,618 | $140,477 |
| 2017 | $2,648 | $185,388 | $47,665 | $137,723 |
| 2016 | $2,548 | $181,754 | $46,731 | $135,023 |
| 2015 | $2,491 | $179,025 | $46,030 | $132,995 |
| 2014 | $2,420 | $175,519 | $45,129 | $130,390 |
Source: Public Records
Map
Nearby Homes
- 1475 Bassett Dr
- 4869 Wolf Way
- 4888 Clayton Rd Unit 6
- 1511 Parkwood Place
- 1535 Parkwood Place
- 1543 Laverne Ct
- 1358 Swallowtail Rd
- 5025 Valley Crest Dr Unit 147
- 1544 Bailey Rd Unit 39
- 1544 Bailey Rd Unit 3
- 5017 Murchio Dr
- 5050 Valley Crest Dr Unit 63
- 5055 Valley Crest Dr Unit 196
- 1590 Laverne Way
- 5060 Valley Crest Dr Unit 56
- 4719 Springwood Way
- 5091 Saint Celestine Ct
- 4632 Melody Dr Unit E
- 5070 Bonwell Dr
- 4417 Catalpa Ct
Your Personal Tour Guide
Ask me questions while you tour the home.