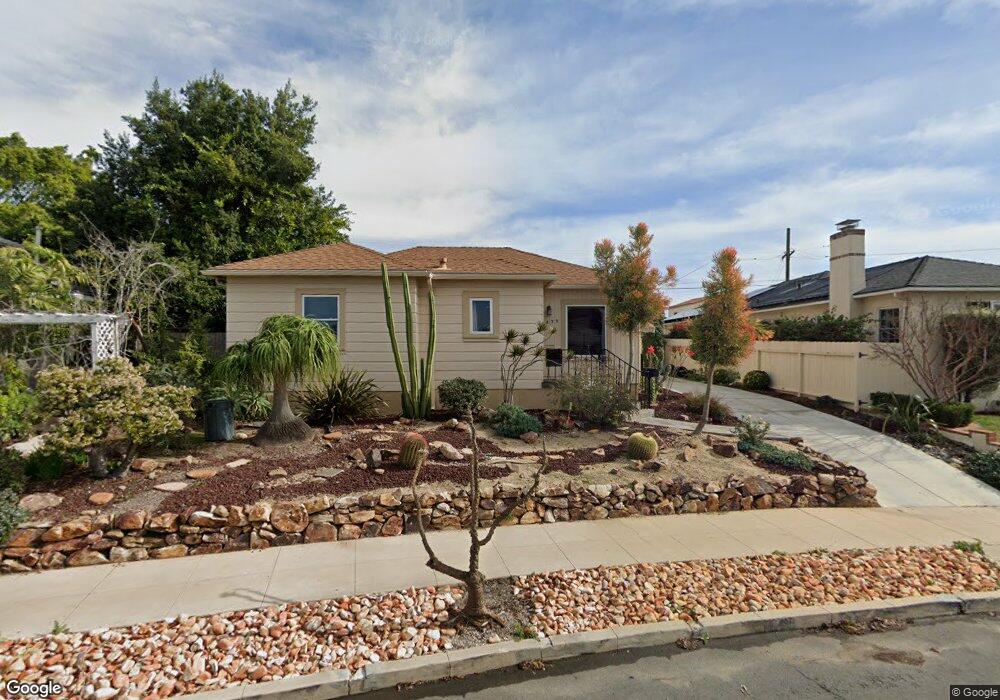
4839 Hart Dr San Diego, CA 92116
Kensington NeighborhoodEstimated Value: $1,321,677 - $1,527,000
3
Beds
2
Baths
1,238
Sq Ft
$1,185/Sq Ft
Est. Value
About This Home
This home is located at 4839 Hart Dr, San Diego, CA 92116 and is currently estimated at $1,466,919, approximately $1,184 per square foot. 4839 Hart Dr is a home located in San Diego County with nearby schools including Franklin Elementary School, Wilson Middle School, and Lewis Middle School.
Ownership History
Date
Name
Owned For
Owner Type
Purchase Details
Closed on
Aug 17, 2015
Sold by
Fisher Dorothy J
Bought by
Smith Barbara C
Current Estimated Value
Purchase Details
Closed on
Mar 27, 2015
Sold by
Smith Barbara C
Bought by
Fisher Dorothy J
Purchase Details
Closed on
Jan 26, 2000
Sold by
Smith Barbara C
Bought by
Smith Barbara C
Purchase Details
Closed on
Sep 22, 1999
Sold by
Smith Barbara C and Smith Burton J
Bought by
Smith Barbara C
Home Financials for this Owner
Home Financials are based on the most recent Mortgage that was taken out on this home.
Original Mortgage
$115,000
Interest Rate
7.62%
Purchase Details
Closed on
Apr 8, 1999
Sold by
Smith Living Trust 04-20-93 and Collette Barbara
Bought by
Smith Barbara C and Smith Burton J
Purchase Details
Closed on
Aug 30, 1984
Create a Home Valuation Report for This Property
The Home Valuation Report is an in-depth analysis detailing your home's value as well as a comparison with similar homes in the area
Home Values in the Area
Average Home Value in this Area
Purchase History
| Date | Buyer | Sale Price | Title Company |
|---|---|---|---|
| Smith Barbara C | -- | None Available | |
| Fisher Dorothy J | -- | None Available | |
| Smith Barbara C | -- | -- | |
| Smith Barbara C | -- | Fidelity National Title | |
| Smith Barbara C | -- | -- | |
| -- | $113,000 | -- |
Source: Public Records
Mortgage History
| Date | Status | Borrower | Loan Amount |
|---|---|---|---|
| Previous Owner | Smith Barbara C | $115,000 |
Source: Public Records
Tax History Compared to Growth
Tax History
| Year | Tax Paid | Tax Assessment Tax Assessment Total Assessment is a certain percentage of the fair market value that is determined by local assessors to be the total taxable value of land and additions on the property. | Land | Improvement |
|---|---|---|---|---|
| 2025 | $4,261 | $349,368 | $225,213 | $124,155 |
| 2024 | $4,261 | $342,519 | $220,798 | $121,721 |
| 2023 | $4,163 | $335,804 | $216,469 | $119,335 |
| 2022 | $4,046 | $329,221 | $212,225 | $116,996 |
| 2021 | $4,012 | $322,766 | $208,064 | $114,702 |
| 2020 | $3,963 | $319,457 | $205,931 | $113,526 |
| 2019 | $3,889 | $313,194 | $201,894 | $111,300 |
| 2018 | $3,638 | $307,054 | $197,936 | $109,118 |
| 2017 | $3,550 | $301,034 | $194,055 | $106,979 |
| 2016 | $8,132 | $690,369 | $558,387 | $131,982 |
| 2015 | $3,438 | $290,700 | $187,393 | $103,307 |
| 2014 | $3,384 | $285,007 | $183,723 | $101,284 |
Source: Public Records
Map
Nearby Homes
- 4306 Aldine Dr Unit 1 to 6, 1 to 3 total
- 4354 N Talmadge Dr
- 4192 Rochester Rd
- 4349 Adams Ave
- 5150 Bristol Rd
- 4417 Braeburn Rd
- 4223 Middlesex Dr
- 4153 1/2 Adams Ave
- 4153 Adams Ave
- 5050 Marlborough Dr (-70)
- 4706 Norma Dr
- 5216 Caminito Solitario
- 4576 44th St
- 4613 Janet Place
- 4596 Vista St
- 4671-73 Terrace Dr
- 4336 Caminito de la Escena
- 4551 Highland Ave
- 4205 Caminito Pintoresco
- 4554 Marlborough Dr Unit 2