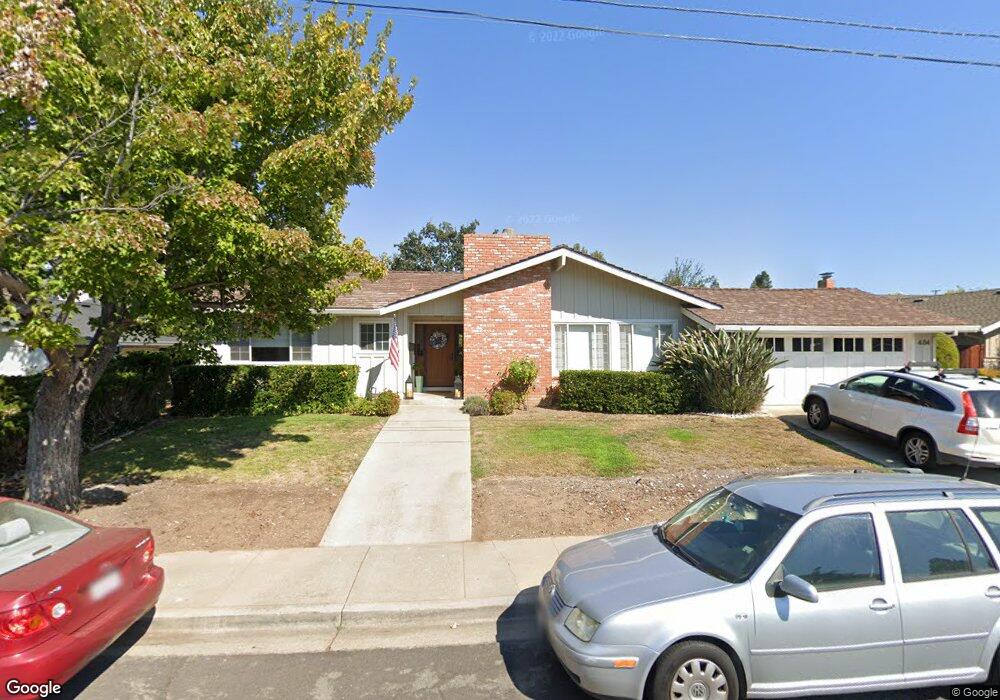
484 Fenway Dr Walnut Creek, CA 94598
Brooktree North NeighborhoodEstimated Value: $1,568,000 - $1,699,000
4
Beds
2
Baths
2,018
Sq Ft
$805/Sq Ft
Est. Value
About This Home
This home is located at 484 Fenway Dr, Walnut Creek, CA 94598 and is currently estimated at $1,624,743, approximately $805 per square foot. 484 Fenway Dr is a home located in Contra Costa County with nearby schools including Walnut Acres Elementary School, Foothill Middle School, and Northgate High School.
Ownership History
Date
Name
Owned For
Owner Type
Purchase Details
Closed on
Jul 15, 2016
Sold by
Melton Kirsten T and Melton Mark A
Bought by
Melton Mark A and Melton Kirsten T
Current Estimated Value
Home Financials for this Owner
Home Financials are based on the most recent Mortgage that was taken out on this home.
Original Mortgage
$600,000
Outstanding Balance
$479,290
Interest Rate
3.6%
Mortgage Type
New Conventional
Estimated Equity
$1,145,453
Purchase Details
Closed on
Jun 4, 2015
Sold by
Melton Mark A and Melton Kirsten T
Bought by
Mark A Melton & Kirsten T Melton 2013 Re
Purchase Details
Closed on
Jul 19, 2001
Sold by
Chetcuti Benny
Bought by
Melton Mark A and Melton Kirsten T
Home Financials for this Owner
Home Financials are based on the most recent Mortgage that was taken out on this home.
Original Mortgage
$500,000
Interest Rate
7.21%
Mortgage Type
Purchase Money Mortgage
Purchase Details
Closed on
Mar 19, 2001
Sold by
Chetcuti Kimberly Marie
Bought by
Chetcuti Benny
Home Financials for this Owner
Home Financials are based on the most recent Mortgage that was taken out on this home.
Original Mortgage
$250,000
Interest Rate
7.06%
Mortgage Type
Purchase Money Mortgage
Create a Home Valuation Report for This Property
The Home Valuation Report is an in-depth analysis detailing your home's value as well as a comparison with similar homes in the area
Home Values in the Area
Average Home Value in this Area
Purchase History
| Date | Buyer | Sale Price | Title Company |
|---|---|---|---|
| Melton Mark A | -- | Accommodation | |
| Melton Kirsten T | -- | Fidelity National Title Co | |
| Mark A Melton & Kirsten T Melton 2013 Re | -- | None Available | |
| Melton Mark A | $643,000 | American Title Co | |
| Chetcuti Benny | -- | American Title Co | |
| Chetcuti Benny | $515,000 | American Title Co |
Source: Public Records
Mortgage History
| Date | Status | Borrower | Loan Amount |
|---|---|---|---|
| Open | Melton Kirsten T | $600,000 | |
| Closed | Melton Mark A | $500,000 | |
| Previous Owner | Chetcuti Benny | $250,000 | |
| Closed | Chetcuti Benny | $250,000 | |
| Closed | Melton Mark A | $78,600 |
Source: Public Records
Tax History Compared to Growth
Tax History
| Year | Tax Paid | Tax Assessment Tax Assessment Total Assessment is a certain percentage of the fair market value that is determined by local assessors to be the total taxable value of land and additions on the property. | Land | Improvement |
|---|---|---|---|---|
| 2025 | $11,019 | $949,885 | $517,047 | $432,838 |
| 2024 | $11,019 | $931,260 | $506,909 | $424,351 |
| 2023 | $10,840 | $913,001 | $496,970 | $416,031 |
| 2022 | $10,744 | $895,100 | $487,226 | $407,874 |
| 2021 | $10,504 | $877,550 | $477,673 | $399,877 |
| 2019 | $10,284 | $851,523 | $463,506 | $388,017 |
| 2018 | $9,912 | $834,827 | $454,418 | $380,409 |
| 2017 | $9,598 | $818,458 | $445,508 | $372,950 |
| 2016 | $9,372 | $802,411 | $436,773 | $365,638 |
| 2015 | $9,308 | $790,359 | $430,213 | $360,146 |
| 2014 | $9,188 | $774,878 | $421,786 | $353,092 |
Source: Public Records
Map
Nearby Homes
- 24 Alden Ct
- 265 Dover Dr
- 419 Las Lomas Way
- 232 Clyde Dr
- 206 Santa fe Dr
- 1032 Millbrook Ct
- 817 Cheyenne Dr
- 942 Cheyenne Dr
- 1919 Ygnacio Valley Rd Unit 71
- 1839 Stratton Cir
- 631 La Vista Rd
- 849 Tampico
- 700 Tampico
- 1413 Walnut Ave
- 208 Siskiyou Ct
- 2975 Hurlstone Ct
- 500 Tampico
- 295 Kinross Dr
- 347 Kinross Dr
- 407 Tampico
- 496 Fenway Dr
- 472 Fenway Dr
- 81 Las Lomas Way
- 95 Las Lomas Way
- 67 Las Lomas Way
- 459 Warwick Dr
- 460 Fenway Dr
- 475 Fenway Dr
- 508 Fenway Dr
- 111 Las Lomas Way
- 53 Las Lomas Way
- 463 Fenway Dr
- 445 Warwick Dr
- 448 Fenway Dr
- 113 Las Lomas Way
- 511 Fenway Dr
- 460 Warwick Dr
- 86 Las Lomas Way
- 39 Las Lomas Way
- 516 Fenway Dr