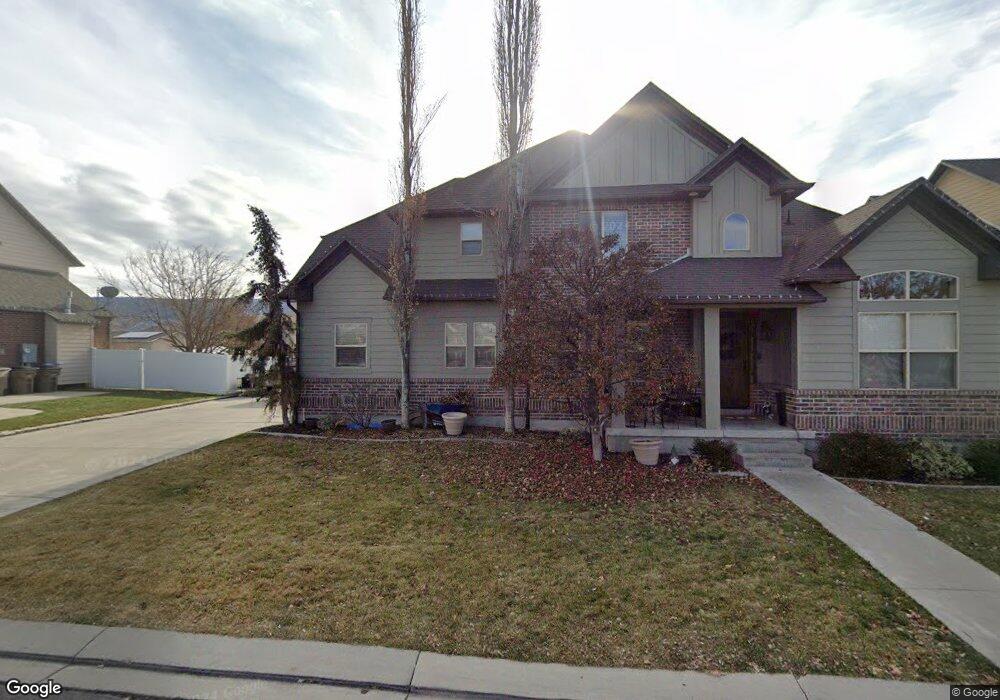
484 Fox Farm Place Draper, UT 84020
Estimated Value: $814,000 - $881,000
4
Beds
4
Baths
1,952
Sq Ft
$435/Sq Ft
Est. Value
About This Home
This home is located at 484 Fox Farm Place, Draper, UT 84020 and is currently estimated at $848,295, approximately $434 per square foot. 484 Fox Farm Place is a home located in Salt Lake County with nearby schools including Draper Elementary School, Corner Canyon High School, and Draper Park Middle School.
Ownership History
Date
Name
Owned For
Owner Type
Purchase Details
Closed on
Dec 15, 2016
Sold by
Clatyon Curtis G and Clatyon Jacy L
Bought by
Clayton Curtis G and Clayton Jacy L
Current Estimated Value
Purchase Details
Closed on
Jul 2, 2010
Sold by
Clayton Curtis and Clayton Jacy
Bought by
Clayton Curtis G and Clayton Jacy L
Home Financials for this Owner
Home Financials are based on the most recent Mortgage that was taken out on this home.
Original Mortgage
$210,000
Outstanding Balance
$140,035
Interest Rate
4.79%
Mortgage Type
New Conventional
Estimated Equity
$708,260
Purchase Details
Closed on
Feb 8, 2006
Sold by
Olsen & Associates Construction Inc
Bought by
Clayton Curtis and Clayton Jacy
Home Financials for this Owner
Home Financials are based on the most recent Mortgage that was taken out on this home.
Original Mortgage
$225,000
Interest Rate
6.16%
Mortgage Type
New Conventional
Create a Home Valuation Report for This Property
The Home Valuation Report is an in-depth analysis detailing your home's value as well as a comparison with similar homes in the area
Home Values in the Area
Average Home Value in this Area
Purchase History
| Date | Buyer | Sale Price | Title Company |
|---|---|---|---|
| Clayton Curtis G | -- | None Available | |
| Clayton Curtis G | -- | Premier Title Ins Agency | |
| Clayton Curtis | -- | Equity Title |
Source: Public Records
Mortgage History
| Date | Status | Borrower | Loan Amount |
|---|---|---|---|
| Open | Clayton Curtis G | $210,000 | |
| Closed | Clayton Curtis | $225,000 |
Source: Public Records
Tax History Compared to Growth
Tax History
| Year | Tax Paid | Tax Assessment Tax Assessment Total Assessment is a certain percentage of the fair market value that is determined by local assessors to be the total taxable value of land and additions on the property. | Land | Improvement |
|---|---|---|---|---|
| 2025 | $3,738 | $750,500 | $216,700 | $533,800 |
| 2024 | $3,738 | $714,000 | $208,700 | $505,300 |
| 2023 | $3,719 | $705,200 | $203,800 | $501,400 |
| 2022 | $0 | $720,200 | $199,800 | $520,400 |
| 2021 | $3,359 | $525,500 | $188,300 | $337,200 |
| 2020 | $3,196 | $474,000 | $175,000 | $299,000 |
| 2019 | $3,189 | $462,100 | $175,000 | $287,100 |
| 2018 | $3,042 | $450,600 | $175,000 | $275,600 |
| 2017 | $3,051 | $432,900 | $166,600 | $266,300 |
| 2016 | $3,058 | $442,100 | $162,200 | $279,900 |
| 2015 | $2,968 | $379,000 | $165,400 | $213,600 |
| 2014 | $2,764 | $344,800 | $152,400 | $192,400 |
Source: Public Records
Map
Nearby Homes
- 479 Fox Farm Place
- 480 E Foxstone Cove
- 633 E Vandalay Ln
- 352 E Mistilake Ln Unit 20
- 194 Bridgepark Cir
- 847 E Willow Springs Ln
- 902 E 12650 S
- 224 Spencer Peak Way Unit F6
- 12073 S 300 E
- 13080 S Crystal Spring Dr
- 196 E Spencer Peak Way Unit D6
- 468 E 12000 S
- 164 E Spencer Peak Way Unit A12
- 164 Spencer Peak Way Unit A6
- 834 E 12085 S
- 205 Rockey Park Ln
- 13181 S Woodridge Oak Dr
- 544 E 11900 S
- 677 E Moray Hill Ct
- 12959 S Fort St
- 502 E Fox Farm Place
- 502 Fox Farm Place
- 468 Fox Farm Place
- 468 E Fox Farm Place
- 499 E 12600 S
- 487 E 12600 S
- 518 E Fox Farm Place
- 518 Fox Farm Place
- 497 E Fox Farm Place
- 497 Fox Farm Place
- 12579 S Clover Dr
- 517 E 12600 S
- 456 Fox Farm Place
- 456 Fox Farm Place Unit 10
- 513 Fox Farm Place
- 471 E 12600 S
- 534 Fox Farm Place
- 463 Fox Farm Place
- 463 E Fox Farm Place
- 459 E Fox Farm Place