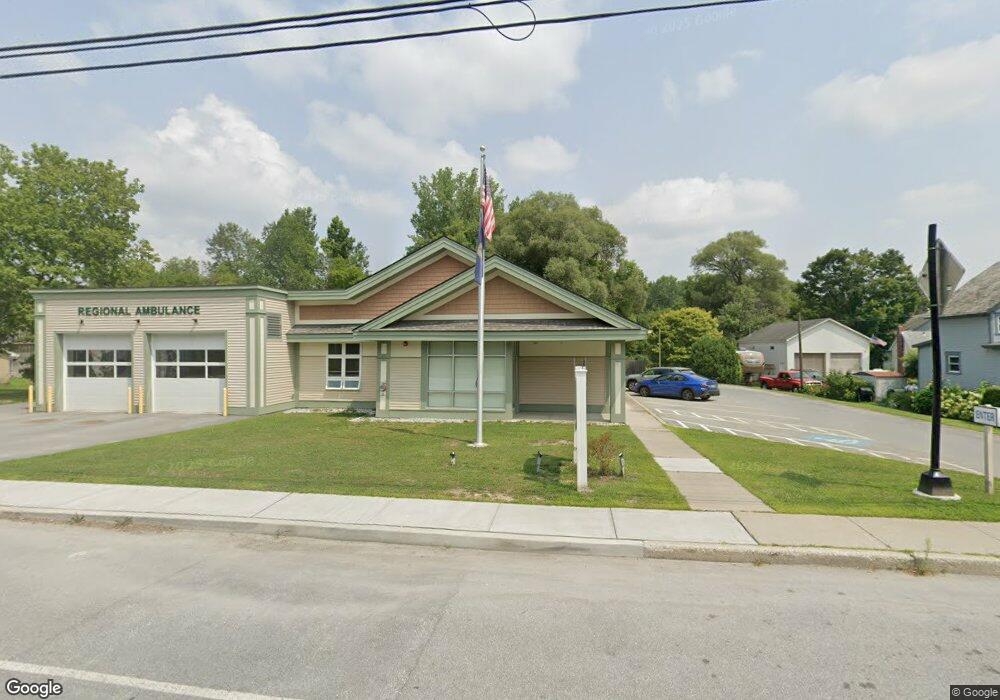
484 Main St West Rutland, VT 05777
Estimated Value: $351,673
--
Bed
--
Bath
2,144
Sq Ft
$164/Sq Ft
Est. Value
About This Home
This home is located at 484 Main St, West Rutland, VT 05777 and is currently priced at $351,673, approximately $164 per square foot. 484 Main St is a home located in Rutland County with nearby schools including West Rutland School and Mount St. Joseph Academy.
Ownership History
Date
Name
Owned For
Owner Type
Purchase Details
Closed on
Nov 7, 2022
Sold by
Chase Realty Partners Llc
Bought by
Regional Ambulance Service Inc
Current Estimated Value
Purchase Details
Closed on
Oct 15, 2021
Sold by
Irealty Investments Llc
Purchase Details
Closed on
Oct 27, 2003
Sold by
Gawet Monica J Trustee and Gawet Stanley J Marital Trust
Bought by
First Brandon National Bank
Create a Home Valuation Report for This Property
The Home Valuation Report is an in-depth analysis detailing your home's value as well as a comparison with similar homes in the area
Home Values in the Area
Average Home Value in this Area
Purchase History
| Date | Buyer | Sale Price | Title Company |
|---|---|---|---|
| Regional Ambulance Service Inc | $349,900 | -- | |
| Regional Ambulance Service Inc | $349,900 | -- | |
| Regional Ambulance Service Inc | $349,900 | -- | |
| -- | $285,000 | -- | |
| -- | $285,000 | -- | |
| -- | $150,000 | -- | |
| -- | $150,000 | -- | |
| -- | $285,000 | -- | |
| First Brandon National Bank | $90,000 | -- |
Source: Public Records
Tax History Compared to Growth
Tax History
| Year | Tax Paid | Tax Assessment Tax Assessment Total Assessment is a certain percentage of the fair market value that is determined by local assessors to be the total taxable value of land and additions on the property. | Land | Improvement |
|---|---|---|---|---|
| 2024 | $19,821 | $732,500 | $94,500 | $638,000 |
| 2023 | $11,108 | $636,600 | $94,500 | $542,100 |
| 2022 | $14,160 | $488,700 | $52,200 | $436,500 |
| 2021 | $11,111 | $488,700 | $52,200 | $436,500 |
| 2020 | $11,016 | $488,700 | $52,200 | $436,500 |
| 2019 | $10,117 | $488,700 | $52,200 | $436,500 |
| 2018 | $9,819 | $446,500 | $56,600 | $389,900 |
| 2017 | $9,998 | $446,500 | $56,600 | $389,900 |
| 2016 | $9,635 | $446,500 | $56,600 | $389,900 |
Source: Public Records
Map
Nearby Homes
- 469 Main St
- 90 Elm St
- 25 Proctor St
- 23 Proctor St
- 326 Main St
- 101 High St
- 653 Main St
- 230 Marble St
- 888 Pleasant St
- 14 Anderson St
- 374 Pinehill Rd
- 124 Flory Heights
- 260 Business Route 4
- 15 Shedd Place
- 19 Shedd Place
- 1321 Quarterline Rd
- 60 Stone Ridge Dr
- 133 Dorr Dr
- 86 Hazel St
- 202 Scotts Rd Unit IRA