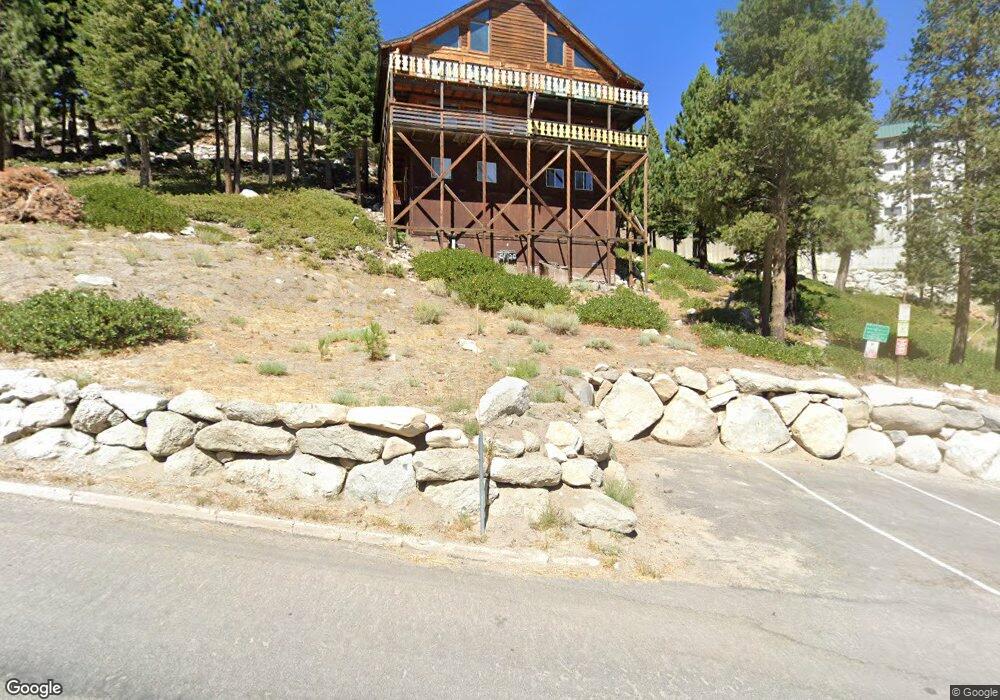
484 Quaking Aspen Ln Unit A Stateline, NV 89449
Estimated Value: $620,701 - $872,000
3
Beds
2
Baths
1,310
Sq Ft
$582/Sq Ft
Est. Value
About This Home
This home is located at 484 Quaking Aspen Ln Unit A, Stateline, NV 89449 and is currently estimated at $762,675, approximately $582 per square foot. 484 Quaking Aspen Ln Unit A is a home located in Douglas County with nearby schools including Gene Scarselli Elementary School, Pau Wa Lu Middle School, and Douglas County High School.
Ownership History
Date
Name
Owned For
Owner Type
Purchase Details
Closed on
Dec 28, 2017
Sold by
Fenwick Hugh and Fenwick Karin Veronica
Bought by
Gaffney Robert M and Gaffney Donna J
Current Estimated Value
Home Financials for this Owner
Home Financials are based on the most recent Mortgage that was taken out on this home.
Original Mortgage
$245,000
Outstanding Balance
$206,539
Interest Rate
3.9%
Mortgage Type
New Conventional
Estimated Equity
$556,136
Purchase Details
Closed on
Dec 14, 2015
Sold by
Hamma Thomas R
Bought by
Fenwick Hugh and Franck Karin Veronica
Purchase Details
Closed on
Aug 22, 2005
Sold by
Mosedale Zachary V and Mosedale Cara I
Bought by
Hamma Thomas R
Home Financials for this Owner
Home Financials are based on the most recent Mortgage that was taken out on this home.
Original Mortgage
$323,000
Interest Rate
5.25%
Mortgage Type
Adjustable Rate Mortgage/ARM
Create a Home Valuation Report for This Property
The Home Valuation Report is an in-depth analysis detailing your home's value as well as a comparison with similar homes in the area
Home Values in the Area
Average Home Value in this Area
Purchase History
| Date | Buyer | Sale Price | Title Company |
|---|---|---|---|
| Gaffney Robert M | $455,000 | None Available | |
| Fenwick Hugh | $235,000 | Western Title Co | |
| Hamma Thomas R | $431,000 | First American Title Company |
Source: Public Records
Mortgage History
| Date | Status | Borrower | Loan Amount |
|---|---|---|---|
| Open | Gaffney Robert M | $245,000 | |
| Previous Owner | Hamma Thomas R | $323,000 |
Source: Public Records
Tax History Compared to Growth
Tax History
| Year | Tax Paid | Tax Assessment Tax Assessment Total Assessment is a certain percentage of the fair market value that is determined by local assessors to be the total taxable value of land and additions on the property. | Land | Improvement |
|---|---|---|---|---|
| 2025 | $1,825 | $89,525 | $64,750 | $24,775 |
| 2024 | $1,711 | $90,918 | $64,750 | $26,168 |
| 2023 | $1,711 | $88,020 | $64,750 | $23,270 |
| 2022 | $1,566 | $81,810 | $59,500 | $22,310 |
| 2021 | $1,450 | $75,709 | $54,250 | $21,459 |
| 2020 | $1,367 | $74,550 | $54,250 | $20,300 |
| 2019 | $1,319 | $70,296 | $50,050 | $20,246 |
| 2018 | $1,258 | $65,559 | $45,500 | $20,059 |
| 2017 | $1,208 | $65,780 | $45,500 | $20,280 |
| 2016 | $1,217 | $65,329 | $43,750 | $21,579 |
| 2015 | $1,215 | $65,329 | $43,750 | $21,579 |
| 2014 | $1,179 | $60,557 | $40,250 | $20,307 |
Source: Public Records
Map
Nearby Homes
- 416 Quaking Aspen Ln Unit P
- 771 N Bowl Unit B
- 383 Tramway Dr Unit B
- 363 Tramway Dr
- 761 Milky Way Ct Unit 1
- 758 Milky Way Ct Unit B
- 331 Tramway Dr Unit 10
- 331 Tramway Dr Unit 4
- 331 Tramway Dr Unit 13
- 323 Tramway Dr Unit 207
- 323 Tramway Dr Unit 301
- 323 Tramway Dr Unit 407
- 323 Tramway Dr Unit 202
- 323 Tramway Dr Unit 306
- 323 Tramway Dr Unit 308
- 313 Tramway Dr Unit 20
- 313 Tramway Dr Unit 8
- 305 Galaxy Ln Unit 3
- 305 Galaxy Ln Unit 2
- 305 Galaxy Ln Unit 8
- 484 Quaking Aspen Ln
- 484 Quaking Aspen Ln
- 484 Quaking Aspen Ln Unit B
- 484 Quaking Aspen Ln Unit D
- 484 Quaking Aspen Ln Unit D
- 484 Quaking Aspen Ln Unit B
- 484 Quaking Aspen Ln Unit A
- 484 Quaking Aspen Ln Unit C
- 484 Quaking Apsen
- 484 Quaking Apsen Unit A
- 436A Quaking Aspen
- 436 Quaking Aspen
- 436-C Quaking Aspen Ln
- 436A Quaking Aspen Unit A
- 436 Quaking Aspen Unit D
- 436-C Quaking Aspen Ln Unit C
- 436 Quaking Aspen Unit C
- 448 Quaking Aspen Ln
- 432 Quaking Aspen Ln
- 432 Quaking Aspen Ln Unit C