Estimated Value: $152,000 - $193,320
4
Beds
2
Baths
864
Sq Ft
$200/Sq Ft
Est. Value
About This Home
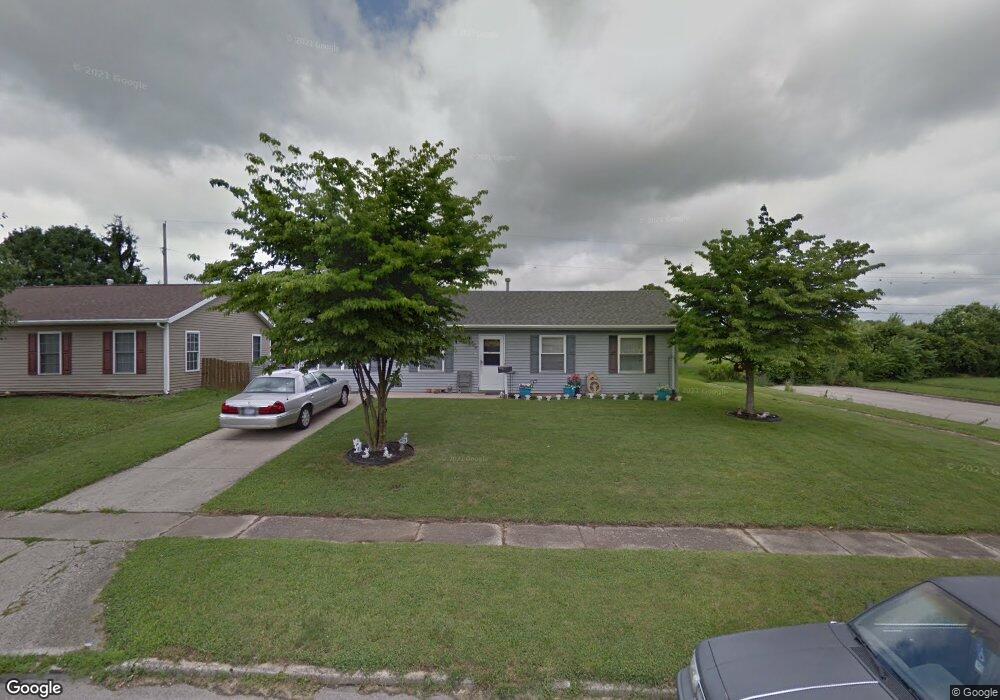
This home is located at 484 Richard Dr, Xenia, OH 45385 and is currently estimated at $172,580, approximately $199 per square foot. 484 Richard Dr is a home located in Greene County with nearby schools including Xenia High School, Summit Academy Community School for Alternative Learners - Xenia, and Legacy Christian Academy.
Ownership History
Date
Name
Owned For
Owner Type
Purchase Details
Closed on
Apr 3, 2008
Sold by
Nationstar Mortgage Llc
Bought by
Kuhner Rebecca L
Current Estimated Value
Home Financials for this Owner
Home Financials are based on the most recent Mortgage that was taken out on this home.
Original Mortgage
$63,995
Outstanding Balance
$40,348
Interest Rate
5.88%
Mortgage Type
Purchase Money Mortgage
Estimated Equity
$132,232
Purchase Details
Closed on
Sep 13, 2007
Sold by
Eagle Bridget J and Eagle Jr Lawrence E
Bought by
Nationstar Mortgage Llc and Centex Home Equity Co Llc
Purchase Details
Closed on
Nov 4, 1994
Sold by
Henderson John E
Bought by
Lawrence & Bridgette Eagle Jr
Home Financials for this Owner
Home Financials are based on the most recent Mortgage that was taken out on this home.
Original Mortgage
$59,500
Interest Rate
8.75%
Mortgage Type
New Conventional
Create a Home Valuation Report for This Property
The Home Valuation Report is an in-depth analysis detailing your home's value as well as a comparison with similar homes in the area
Home Values in the Area
Average Home Value in this Area
Purchase History
| Date | Buyer | Sale Price | Title Company |
|---|---|---|---|
| Kuhner Rebecca L | $65,000 | Prism Title & Closing Servic | |
| Nationstar Mortgage Llc | $48,000 | None Available | |
| Lawrence & Bridgette Eagle Jr | $58,000 | -- |
Source: Public Records
Mortgage History
| Date | Status | Borrower | Loan Amount |
|---|---|---|---|
| Open | Kuhner Rebecca L | $63,995 | |
| Previous Owner | Lawrence & Bridgette Eagle Jr | $59,500 |
Source: Public Records
Tax History Compared to Growth
Tax History
| Year | Tax Paid | Tax Assessment Tax Assessment Total Assessment is a certain percentage of the fair market value that is determined by local assessors to be the total taxable value of land and additions on the property. | Land | Improvement |
|---|---|---|---|---|
| 2024 | $1,945 | $45,450 | $10,270 | $35,180 |
| 2023 | $1,945 | $45,450 | $10,270 | $35,180 |
| 2022 | $1,589 | $31,680 | $7,340 | $24,340 |
| 2021 | $1,611 | $31,680 | $7,340 | $24,340 |
| 2020 | $1,543 | $31,680 | $7,340 | $24,340 |
| 2019 | $1,459 | $28,190 | $5,210 | $22,980 |
| 2018 | $1,464 | $28,190 | $5,210 | $22,980 |
| 2017 | $1,389 | $28,190 | $5,210 | $22,980 |
| 2016 | $1,390 | $26,250 | $5,210 | $21,040 |
| 2015 | $1,394 | $26,250 | $5,210 | $21,040 |
| 2014 | $1,334 | $26,250 | $5,210 | $21,040 |
Source: Public Records
Map
Nearby Homes
- 1351 Omard Dr
- 343 Sheelin Rd
- 1430 Reid Ave
- 1391 June Dr
- 912 Omard Dr
- 1283 June Dr
- 883 Omard Dr
- 1233 June Dr
- 509 Antrim Rd
- 1342 Kylemore Dr
- 121 S Progress Dr
- Harmony Plan at Grandstone Trace
- Newcastle Plan at Grandstone Trace
- Pendleton Plan at Grandstone Trace
- Bellamy Plan at Grandstone Trace
- Chatham Plan at Grandstone Trace
- 532 Hollywood Blvd
- 517 Hollywood Blvd
- 1144 Rockwell Dr
- 1796 Palmer Ct