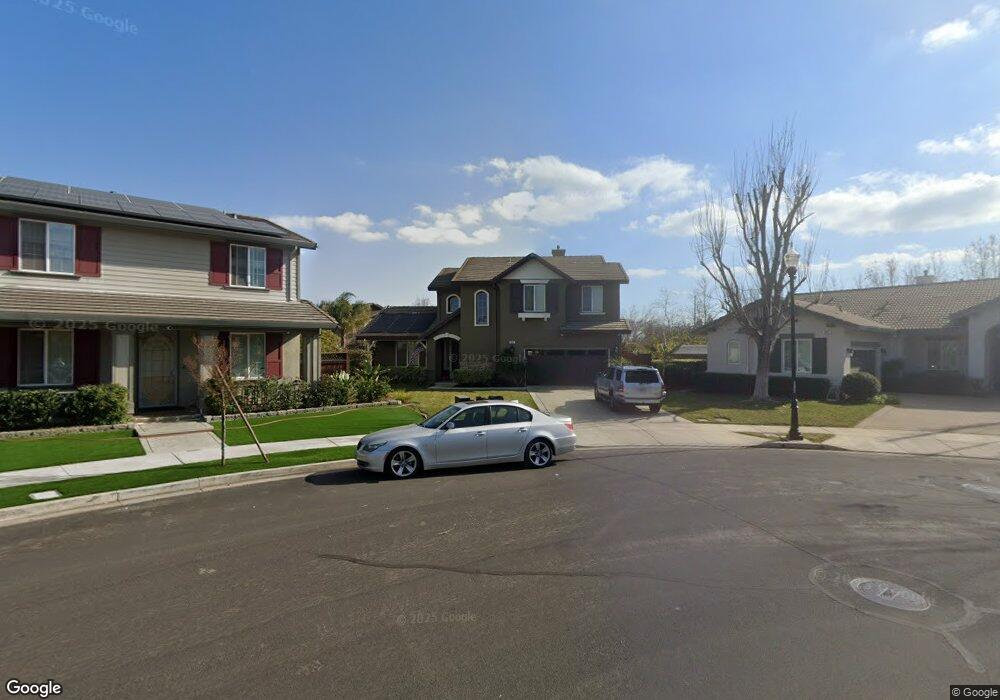
484 Richdale Ct Brentwood, CA 94513
Brentwood Center NeighborhoodEstimated Value: $797,000 - $848,494
3
Beds
3
Baths
2,181
Sq Ft
$376/Sq Ft
Est. Value
About This Home
This home is located at 484 Richdale Ct, Brentwood, CA 94513 and is currently estimated at $820,624, approximately $376 per square foot. 484 Richdale Ct is a home located in Contra Costa County with nearby schools including Mary Casey Black Elementary School, Edna Hill Middle School, and Liberty High School.
Ownership History
Date
Name
Owned For
Owner Type
Purchase Details
Closed on
May 1, 2013
Sold by
Signature At Cedarwood Llc
Bought by
Cardoza Valerie and Escobedo Juan
Current Estimated Value
Home Financials for this Owner
Home Financials are based on the most recent Mortgage that was taken out on this home.
Original Mortgage
$345,000
Outstanding Balance
$244,689
Interest Rate
3.5%
Mortgage Type
New Conventional
Estimated Equity
$575,935
Create a Home Valuation Report for This Property
The Home Valuation Report is an in-depth analysis detailing your home's value as well as a comparison with similar homes in the area
Home Values in the Area
Average Home Value in this Area
Purchase History
| Date | Buyer | Sale Price | Title Company |
|---|---|---|---|
| Cardoza Valerie | $415,000 | Old Republic Title Company |
Source: Public Records
Mortgage History
| Date | Status | Borrower | Loan Amount |
|---|---|---|---|
| Open | Cardoza Valerie | $345,000 |
Source: Public Records
Tax History Compared to Growth
Tax History
| Year | Tax Paid | Tax Assessment Tax Assessment Total Assessment is a certain percentage of the fair market value that is determined by local assessors to be the total taxable value of land and additions on the property. | Land | Improvement |
|---|---|---|---|---|
| 2025 | $9,317 | $551,990 | $121,903 | $430,087 |
| 2024 | $9,070 | $541,167 | $119,513 | $421,654 |
| 2023 | $9,070 | $530,557 | $117,170 | $413,387 |
| 2022 | $8,829 | $520,155 | $114,873 | $405,282 |
| 2021 | $8,633 | $509,957 | $112,621 | $397,336 |
| 2019 | $8,610 | $494,833 | $109,282 | $385,551 |
| 2018 | $8,459 | $485,132 | $107,140 | $377,992 |
| 2017 | $7,965 | $440,327 | $105,040 | $335,287 |
| 2016 | $7,598 | $431,694 | $102,981 | $328,713 |
| 2015 | $7,611 | $425,211 | $101,435 | $323,776 |
| 2014 | $7,471 | $416,883 | $99,449 | $317,434 |
Source: Public Records
Map
Nearby Homes
- 482 Richdale Ct
- 486 Richdale Ct
- 488 Richdale Ct
- 480 Richdale Ct
- 487 Richdale Ct
- 478 Richdale Ct
- 534 Vivian St
- 536 Vivian St
- 489 Richdale Ct
- 538 Vivian St
- 476 Richdale Ct
- 540 Vivian St
- 477 Richdale Ct
- 491 Richdale Ct
- 542 Vivian St
- 474 Richdale Ct
- 526 Vivian St
- 475 Richdale Ct
- 535 Vivian St
- 537 Vivian St