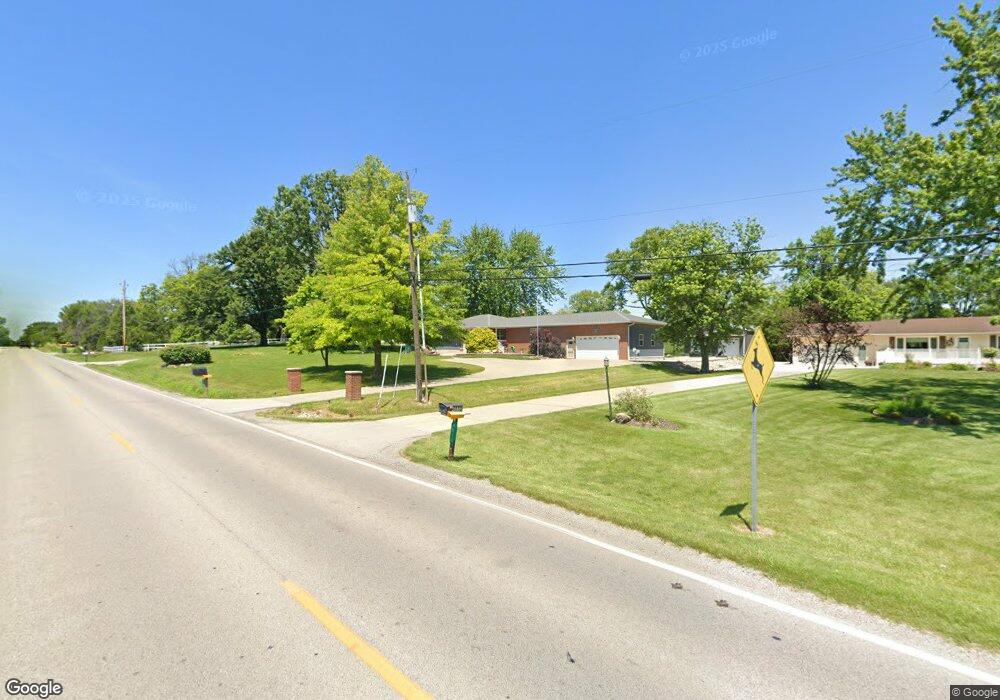
4842 E Lost Bridge Rd Decatur, IL 62521
Estimated Value: $234,000 - $251,000
4
Beds
2
Baths
2,226
Sq Ft
$110/Sq Ft
Est. Value
About This Home
This home is located at 4842 E Lost Bridge Rd, Decatur, IL 62521 and is currently estimated at $245,583, approximately $110 per square foot. 4842 E Lost Bridge Rd is a home located in Macon County with nearby schools including McGaughey Elementary School, Mt. Zion Intermediate School, and Mt. Zion Elementary School.
Ownership History
Date
Name
Owned For
Owner Type
Purchase Details
Closed on
Aug 30, 2010
Sold by
Mirani Dharmesh C and Mirani Bhavna D
Bought by
Huffman Jimmy P and Huffman Stacey
Current Estimated Value
Home Financials for this Owner
Home Financials are based on the most recent Mortgage that was taken out on this home.
Original Mortgage
$192,000
Outstanding Balance
$127,809
Interest Rate
4.6%
Mortgage Type
Future Advance Clause Open End Mortgage
Estimated Equity
$117,774
Purchase Details
Closed on
Feb 27, 2008
Sold by
Peck Gary L and Peck Lynn E
Bought by
Mirani Bhavna D and Mirani Dharmesh C
Home Financials for this Owner
Home Financials are based on the most recent Mortgage that was taken out on this home.
Original Mortgage
$95,000
Interest Rate
5.75%
Mortgage Type
Future Advance Clause Open End Mortgage
Purchase Details
Closed on
Feb 2, 2006
Sold by
Owen Gayle Lynn and Tracy Gregoy Marc
Bought by
Peek Gary L and Peek Dynn E
Create a Home Valuation Report for This Property
The Home Valuation Report is an in-depth analysis detailing your home's value as well as a comparison with similar homes in the area
Purchase History
| Date | Buyer | Sale Price | Title Company |
|---|---|---|---|
| Huffman Jimmy P | $120,000 | None Available | |
| Mirani Bhavna D | $127,000 | None Available | |
| Peek Gary L | $116,000 | None Available |
Source: Public Records
Mortgage History
| Date | Status | Borrower | Loan Amount |
|---|---|---|---|
| Open | Huffman Jimmy P | $192,000 | |
| Previous Owner | Mirani Bhavna D | $95,000 |
Source: Public Records
Tax History
| Year | Tax Paid | Tax Assessment Tax Assessment Total Assessment is a certain percentage of the fair market value that is determined by local assessors to be the total taxable value of land and additions on the property. | Land | Improvement |
|---|---|---|---|---|
| 2024 | $4,817 | $82,615 | $9,937 | $72,678 |
| 2023 | $4,669 | $76,765 | $9,233 | $67,532 |
| 2022 | $4,383 | $72,178 | $8,681 | $63,497 |
| 2021 | $4,252 | $68,427 | $8,230 | $60,197 |
| 2020 | $4,083 | $65,397 | $7,865 | $57,532 |
| 2019 | $4,083 | $65,397 | $7,865 | $57,532 |
| 2018 | $3,981 | $63,965 | $7,693 | $56,272 |
| 2017 | $3,721 | $63,175 | $7,598 | $55,577 |
| 2016 | $3,720 | $63,137 | $7,593 | $55,544 |
| 2015 | $2,219 | $62,327 | $7,496 | $54,831 |
| 2014 | $2,170 | $62,327 | $7,496 | $54,831 |
| 2013 | $2,193 | $58,865 | $7,496 | $51,369 |
Source: Public Records
Map
Nearby Homes
- 2415 Lot 15 Rolling Creek Ct
- 2405 Lot 14 Rolling Creek Ct
- 3335 S Mount Zion Rd
- 2420 Rolling Creek Ct
- 2347 Rolling Creek Dr
- 2331 Rolling Creek Dr
- 2311 Rolling Creek Dr
- 2295 Rolling Creek Dr
- 2312 Lot 24 Rolling Creek Dr
- 2277 Rolling Creek Dr
- 2261 Rolling Creek Dr
- 2276 Lot 26 Rolling Creek Dr
- 2243 Rolling Creek Dr
- 2258 Lot 27 Rolling Creek Dr
- 2235 Rolling Creek Dr
- 9 Blakeridge Place
- 2457 S Marquette Ct
- 3930 S Mount Zion Rd
- 2562 Redlich Ct
- 5941 Monarch Rd
- 4822 E Lost Bridge Rd
- 4850 E Lost Bridge Rd
- 4764 E Lost Bridge Rd
- 4926 E Lost Bridge Rd
- 4744 E Lost Bridge Rd
- 4960 E Lost Bridge Rd
- 2881 S Mount Zion Rd
- 4734 E Lost Bridge Rd
- 2821 S Mount Zion Rd
- 4827 E Glenwood Dr
- 2761 S Mount Zion Rd
- 4769 E Glenwood Dr
- 4847 E Glenwood Dr
- 4931 E Glenwood Dr
- 4867 E Glenwood Dr
- 2741 S Mount Zion Rd
- 4749 E Glenwood Dr
- 4700 E Lost Bridge Rd
- 355 Mount Zion Rd
- 4949 E Glenwood Dr
Your Personal Tour Guide
Ask me questions while you tour the home.